Linear attribution is one of the simplest ways to measure a multi-touch customer journey. Every eligible interaction receives the same share of conversion credit, so no touchpoint wins simply because it happened first or last.
The arithmetic is easy. The harder question is deciding what belongs in the journey. Attribution windows, repeated interactions, direct traffic, cross-device identity, and missing offline activity can all change which touches are eligible.
This guide explains the formula, worked examples, strengths, weaknesses, and current platform support. It also shows where linear fits among other marketing attribution models and when equal weighting is useful as a baseline rather than a claim about influence.
Linear attribution at a glance
Linear attribution is easy to summarize, but the model becomes more useful when its purpose and limitation are stated together. The table below captures the rule, the most practical use case, and the assumption teams should keep in mind.
| What it is | Formula | Best use | Main limitation |
|---|---|---|---|
| A multi-touch model that gives every eligible touchpoint equal credit | 100% ÷ number of eligible touches | Transparent baseline across a multi-touch journey | Equal credit does not mean equal influence |
| Direct answer: Linear attribution distributes conversion credit equally across every eligible touchpoint in the attribution window. |
Key takeaways
The model is simple enough to explain in one formula, but several implementation details change the result. These are the points to keep in mind before using linear credit for reporting or budget decisions.
- Equal weighting: Every eligible touchpoint receives 1 ÷ N of the conversion credit.
- Easy to calculate: Four eligible touches receive 25% each; five touches receive 20% each.
- Touchpoints, not channels: A channel that appears twice can receive two equal shares of credit.
- Useful baseline: Linear is a transparent way to compare full-journey performance against first-touch or last-touch reporting.
- Not causal: Equal credit is a reporting rule. It does not prove every interaction caused an equal share of the conversion.
- Platform support varies: HubSpot, Klaviyo, Triple Whale, and Usermaven still support linear views, while current GA4 and Google Ads do not offer native selectable linear attribution.
What is a linear attribution model?
A linear attribution model is a multi-touch attribution method that divides conversion credit equally across every eligible touchpoint in a customer journey. It gives the middle of the journey visibility without privileging the first or final interaction.
If four interactions qualify, each receives 25% of the credit. If ten qualify, each receives 10%. The rule stays the same regardless of which channel appeared first, which one closed the conversion, or how persuasive any individual interaction seemed.

This makes linear different from single-touch attribution. The broader marketing attribution framework explains why different models can produce different answers from the same customer journey.
Linear attribution formula
The formula is intentionally simple. Each version below expresses the same equal-weight rule in a way that is useful for percentages, conversion credit, or revenue.
Credit percentage formula
| Formula: Credit per touchpoint = 100% ÷ number of eligible touchpoints |
Conversion-credit formula
| Formula: Touchpoint credit = 1 ÷ N, where N is the number of eligible touchpoints. |
Revenue formula
| Formula: Attributed revenue per touchpoint = conversion revenue ÷ number of eligible touchpoints |
| Eligible touchpoints | Credit per touch |
|---|---|
| 2 | 50% |
| 3 | 33.33% |
| 4 | 25% |
| 5 | 20% |
| 6 | 16.67% |
| 10 | 10% |
The calculation itself does not require machine learning or a large conversion dataset. That simplicity is one reason linear remains useful as a benchmark even when teams eventually use more complex attribution methods.
How linear attribution calculates credit
The easiest way to understand the model is to work through a single conversion. Keep the eligible journey fixed, divide the credit evenly, and then apply the same percentage to the conversion value.
Suppose a customer journey contains four eligible interactions before a $400 purchase:
| Journey: Google Ads → Email → Organic Search → Purchase |
With four eligible touches, the model calculates 100% ÷ 4 = 25% per touch. The $400 of attributed revenue is therefore divided into $100 shares.
- Google Ads = 25% = $100
- Email = 25% = $100
- Organic Search = 25% = $100
- Final eligible interaction = 25% = $100
Linear attribution does not ask which interaction was most persuasive. It applies the same weighting rule to every interaction that the implementation considers eligible.
Linear attribution example for ecommerce
Ecommerce journeys often combine paid discovery, owned channels, and branded demand capture before the order is completed. Linear attribution keeps those assisting touches visible instead of awarding the full order to the final click.
Consider a $300 ecommerce order with this journey:
| Journey: Meta ad → Email → Google Search → Purchase |
There are three eligible touches, so each receives 33.33% of the conversion credit and $100 of attributed revenue.
This view can prevent branded search from receiving 100% of the order when paid social and email helped create or sustain demand earlier. If the retailer also connects downstream customer records through a CRM for retail, the attribution layer can be evaluated against the customer and revenue record the business actually trusts.
Linear attribution example for B2B SaaS
B2B SaaS journeys are usually longer and contain more meaningful touchpoints than a simple checkout path. That makes linear useful for visibility, but also makes equal weighting easier to challenge.
Now consider a longer B2B SaaS journey that ends in $12,000 of Closed Won revenue:
| Journey: Organic article → LinkedIn ad → Webinar → Pricing page → Branded search → Demo |
Six eligible touches means 16.67% credit per touch. Under a pure linear model, each interaction receives $2,000 of attributed revenue.
The benefit is visibility. Early discovery, middle-funnel education, and late demand capture all remain present. The weakness is also obvious: a webinar and a quick pricing-page visit receive exactly the same weight even though their real influence may differ.
Equal touchpoint credit is not equal channel credit
Linear attribution equalizes interactions, not channels. That distinction matters because one channel can appear several times inside the same conversion path.
If a channel appears more often, it can accumulate multiple equal shares even though the weighting rule never changes.

| Example: Google Ads → Email → Organic Search → Email → Demo |
Five touches means 20% per touch. Email appears twice, so the channel receives 40% of total credit even though every individual interaction still receives the same 20% share.
| Channel / interaction | Credit |
|---|---|
| Google Ads | 20% |
| Email touch 1 | 20% |
| Organic Search | 20% |
| Email touch 2 | 20% |
| Demo / final eligible touch | 20% |
| Email total | 40% |
This distinction matters when teams compare channels. A channel can look stronger under linear attribution simply because it creates more recorded interactions in the path.
What counts as an eligible touchpoint?
The arithmetic of linear attribution is simple. Defining the eligible journey is not. A 1 ÷ N formula is only as meaningful as the rules that determine N.
Attribution window
Only interactions inside the lookback period can receive credit. A shorter attribution window can remove early touches and increase the share allocated to every remaining interaction.
Clicks vs impressions
Some implementations count clicked interactions only, while others can include eligible views. Mixing view-through and click-through activity changes both journey length and the meaning of each equal share.
Direct visits
Platforms handle direct traffic differently. Some models ignore direct when another marketing source exists, while others can include it. Triple Whale, for example, documents different direct-traffic rules across Linear All and other model types.
Repeated interactions
Repeated email visits, retargeting ads, or branded searches may each become separate eligible touches. Under linear weighting, more recorded interactions create more cumulative channel credit.
Cross-device identity
A mobile research session and desktop conversion can be split into separate users without reliable identity resolution. Contacts Hub can help connect acquisition and behavioral history with known contacts and companies once identification becomes available.
Offline touchpoints
Sales calls, webinars, events, demos, and CRM interactions can disappear if they are not connected to the same person or account. Customer journey analytics software is useful when teams need to inspect the sequence rather than trust aggregate credit blindly.
| Image brief: How linear attribution splits credit. 1200×630. Show Ad → Email → Organic → Demo → Conversion, with 20% under each eligible touchpoint. Short alt text: Linear attribution credit. |
Linear attribution vs other attribution models
The easiest way to understand model differences is to hold the journey constant and change only the credit rule. This isolates the assumption introduced by the model rather than mixing several measurement changes at once.
| Journey: Organic → LinkedIn → Email → Paid Search → $1,000 conversion |
| Model | How $1,000 is allocated | What it emphasizes |
|---|---|---|
| First touch | Organic = $1,000 | Acquisition |
| Last touch | Paid Search = $1,000 | Final conversion |
| Linear | $250 to each touch | Equal journey visibility |
| U-shaped | Higher weight to first and key conversion-stage touches | Discovery + milestone |
| Time decay | Increasing weight closer to conversion | Late-stage influence |
| Data-driven | Weights based on observed patterns | Estimated contribution |
First-click attribution gives the full conversion to the earliest eligible interaction, while last-click attribution gives it to the final eligible touch. Linear removes that winner-takes-all rule and shares credit across the path.
A U-shaped attribution model deliberately privileges key positions, while time-decay attribution gives more weight to recent touches.
Data-driven attribution uses observed path data and algorithms to estimate contribution, while a custom attribution model can reflect business-specific milestones. Linear remains useful because it provides a simple benchmark against which these assumptions can be compared.
Advantages of linear attribution
Linear attribution is valuable because it is transparent and difficult to misinterpret mathematically. Its strengths are strongest when the team needs a full-journey baseline before introducing more opinionated weighting.

Full-journey visibility
No eligible interaction disappears simply because it happened in the middle. That makes linear useful when first-touch or last-touch reporting consistently hides assisting channels.
Transparent calculation
Anyone can reproduce the result with 1 ÷ N. There is no black-box weighting logic to explain to finance, sales, or leadership.
Low data requirements
Linear attribution does not need machine-learning scale or a large number of conversions. It works as soon as the system can observe a valid multi-touch journey.
Useful baseline
Teams moving away from single-touch reporting can use linear as a neutral benchmark. The key question becomes how channel rankings change once the middle of the journey receives credit.
Easy stakeholder communication
The rule is intuitive: every eligible touch receives the same share. That makes model assumptions visible instead of burying them inside a proprietary score.
Limitations of linear attribution
The model’s simplicity creates its main analytical weakness. Equal credit is consistent, but consistency should not be confused with equal responsibility for the outcome.
Equal credit does not mean equal influence
This is the core limitation. A high-intent demo, a short blog visit, and a retargeting click can receive identical weight even when they played very different roles.
Repeated touches can accumulate more channel credit
If one channel creates four interactions while another creates one, the first channel receives four shares. That may reflect persistence rather than four times the actual influence.
Journey length changes the weighting
A touch receives 50% in a two-touch path but only 10% in a ten-touch path. The interaction did not necessarily become less important; the model simply had more eligible events to divide credit across.
Missing data changes every share
If one real touchpoint is never recorded, the remaining interactions receive larger fractions. Linear attribution always distributes 100% across what it can see, not necessarily everything that actually happened.
It can flatten meaningful funnel differences
A pricing-page visit, sales demo, or product activation may signal much more intent than a casual page view. Pure linear weighting does not recognize that difference.
It does not prove causality
Linear attribution tells you how credit is allocated under an equal-weight rule. It does not prove that each interaction caused an equal share of the conversion. Incrementality tests, experiments, and other causal methods answer a different question.
When should you use linear attribution?
Linear is most useful when the team wants a simple multi-touch baseline and does not have a defensible reason to privilege one eligible touch over another. It becomes less suitable as touchpoint quality diverges or the measurement question shifts from attribution toward causality.
| Situation | Linear fit | Why |
|---|---|---|
| Moving beyond last click | Strong | Gives middle touches visibility |
| Need a transparent baseline | Strong | Equal weighting is easy to audit |
| Limited conversion volume | Strong | No ML-scale dataset required |
| Short multi-touch journey | Good | Easy to interpret |
| Long B2B journey | Conditional | Preserves the path but may flatten influence |
| Strongly different touch quality | Weak | Equal weighting may mislead |
| Mature high-volume attribution | Benchmark | Custom or data-driven models may add nuance |
| Need causal proof | Poor | Attribution does not measure incrementality |
The best use case is often comparison. If last touch says paid search dominates and linear says content, email, and paid social all assist heavily, that difference tells you where the single-touch view may be hiding the rest of the journey.
When should you not use linear attribution?
Linear should not become the primary decision model simply because it is easy to understand. Avoid treating it as the final answer when the customer journey contains interactions with clearly different business meaning.
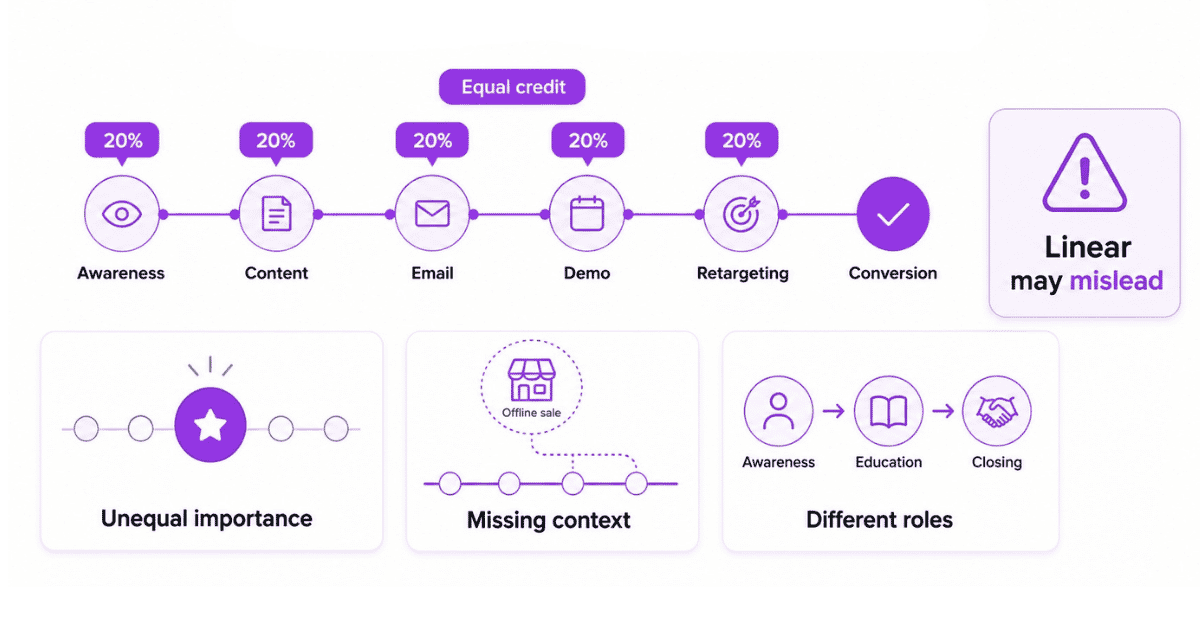
- One or two touchpoints clearly represent major funnel milestones.
- Retargeting or email generates many repeated late-stage interactions.
- Low-value touches greatly outnumber high-intent interactions.
- Important offline sales activity is mostly missing from the journey.
- Channels play radically different roles across awareness, education, and closing.
- The real question is incremental impact rather than credit allocation.
- The organization has enough reliable data for a defensible custom or data-driven approach.
Is linear attribution good for long sales cycles?
Sometimes, but sales-cycle length alone does not make linear the best model. Long journeys need multi-touch visibility, but they also contain more opportunities for unequal touch quality.
Long journeys make multi-touch measurement more important because early discovery and middle-funnel activity should not vanish. Linear helps by keeping every eligible touch visible.
The same long journey can also expose linear’s weakness. A quick repeat visit and a detailed demo may receive identical credit. Long sales cycles make multi-touch attribution more useful, but they do not automatically make equal weighting more accurate.
How attribution windows change linear results
Linear weights only the interactions that remain eligible, so the attribution window changes the denominator in the formula. A shorter window can therefore redistribute credit across every remaining touch even when the conversion itself is unchanged.
Suppose a journey has four eligible touches: A → B → C → D. With all four inside the lookback window, each receives 25%.
If the window is shortened and touch A falls outside it, three touches remain. B, C, and D now receive 33.33% each, even though the conversion itself has not changed.
This is why model comparisons should hold the attribution window constant. Changing both the weighting rule and the eligible journey at the same time makes it difficult to tell which assumption caused the result.
Can you use linear attribution in GA4?
No. GA4 no longer offers linear attribution as a selectable reporting attribution model. That makes many older tutorials inaccurate for current implementations.
Google states that first-click, linear, time-decay, and position-based models have been unavailable since November 2023.
Current GA4 reporting focuses on data-driven attribution and supported last-click variants. Google’s current GA4 attribution documentation confirms the removal of linear from native model selection.
That does not stop a business from analyzing GA4-originated traffic inside another attribution platform. It only means linear is no longer a native GA4 reporting-model choice.
Can you use linear attribution in Google Ads?
No. Google Ads no longer supports linear attribution as a selectable native conversion attribution model. Teams using older rules-based model guidance should separate historical behavior from the current product.
Google’s current attribution model documentation says first click, linear, time decay, and position based are no longer supported. Conversion actions using those models were upgraded to data-driven attribution, with last click remaining available.
The best attribution model for Google Ads therefore needs to distinguish Google’s native options from independent attribution tools that can still apply linear logic to Google Ads journeys.
Which platforms still support linear attribution?
Platform support now varies considerably. That makes it important to separate the general attribution concept from the models available inside a specific tool.
| Platform | Linear available? | Current implementation |
|---|---|---|
| Usermaven | Yes | Linear among seven models, with journey and revenue analysis |
| HubSpot | Yes | Equal credit across interactions in attribution reports |
| Klaviyo | Yes | Linear available for eligible Advanced KDP / Marketing Analytics accounts |
| Triple Whale | Yes | Linear All and Linear Paid variants |
| GA4 | No | Removed from native selectable attribution models |
| Google Ads | No | Deprecated rules-based model |
HubSpot’s current attribution reporting documentation lists Linear alongside First Touch, Last Touch, Time Decay, and Empirical.
Klaviyo’s linear attribution documentation explains how eligible Advanced KDP and Marketing Analytics users can switch from last touch to linear.
Triple Whale documents two variations: Linear All and Linear Paid. Linear All splits credit across paid, owned, organic, and earned touches, while Linear Paid limits the equal split to paid interactions.
How linear attribution works in Usermaven
Usermaven supports linear attribution inside a broader multi-model measurement workflow. The advantage is not simply having another model; it is being able to compare how the same journeys and revenue outcomes change under different credit assumptions.
Choose linear in attribution settings
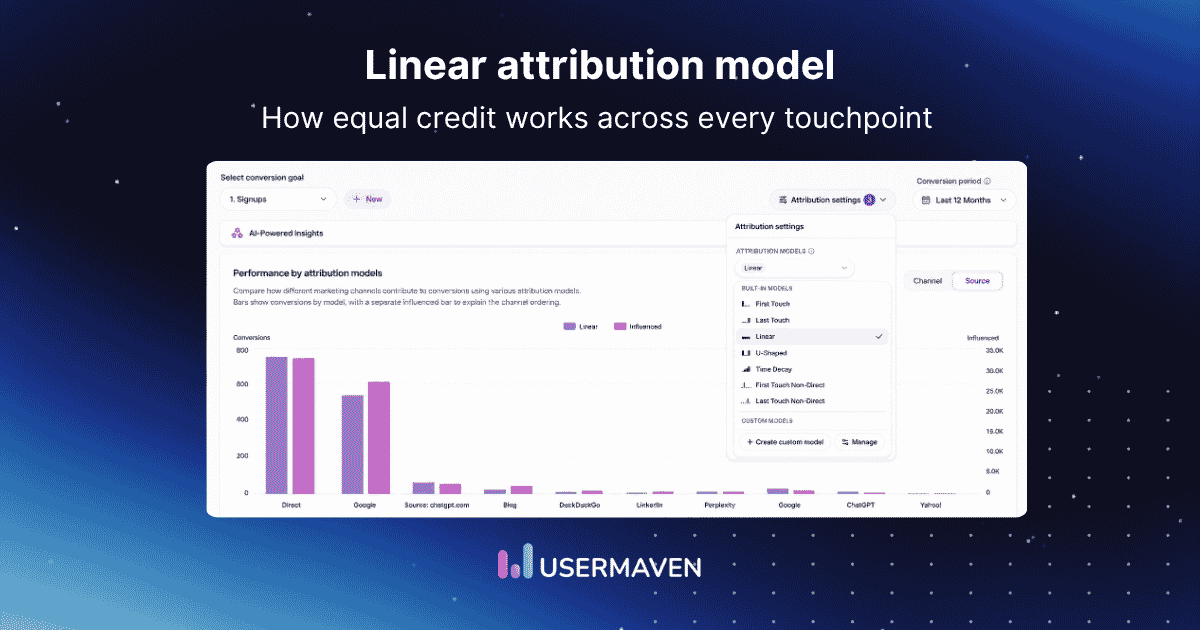
The Marketing Channel & Source Attribution view lets you select a conversion goal, choose the reporting period, and switch the attribution model without rebuilding the report. In the screenshot below, Linear is selected from the attribution settings alongside first touch, last touch, U-shaped, time decay, and non-direct variants.
The chart then compares performance by channel or source, so teams can see how equal-weight linear credit differs from influenced conversions across the same acquisition mix.

Read fractional credit by source
The multi-touch attribution software report can also show linear credit in a source-level table beside broader influenced metrics. Because one conversion can be split across several eligible touches, linear conversions can appear as fractional values rather than whole numbers.
This makes it possible to compare source-level conversion credit, conversion rate, conversion value, and net revenue or LTV in one view instead of treating the attributed conversion count as the only useful output.

Compare the same journey under several models
A team can ask which channels gain credit under linear, which lose credit compared with last touch, and which sources remain strong regardless of the model selected.
Connect the model to revenue
For B2B, the useful outcome may be opportunity, pipeline, or Closed Won. For SaaS, it may be signup, paid conversion, subscription, or another revenue event. The weighting rule should sit on top of the commercial outcome the team actually trusts.
Inspect the journey behind the credit
A model percentage is easier to interpret when the team can open the journey and see the actual sequence of channels, pages, product activity, and conversion events that produced it.
See Usermaven in action
Book a free demo and discover how powerful analytics can grow your business.
Where AI helps attribution analysis
AI is useful when it reduces the time required to compare models and investigate why channel credit moved. It should not decide which assumptions are true.
Compare model outcomes
Maven AI can support questions such as:
- Which channels gain the most credit under linear versus last touch?
- Which source remains strong regardless of attribution model?
- Which campaigns depend heavily on early-touch credit?
- Which channels accumulate repeated linear touchpoints?
- How does the lookback window change attributed revenue?
Explore through MCP
Usermaven MCP can extend approved attribution analysis into compatible AI clients, which is useful when technical teams want to investigate journeys, models, funnels, and revenue without rebuilding each report manually.
Keep human judgment
AI cannot decide what counts as an eligible touchpoint, whether the attribution window matches the buying cycle, or whether an observed relationship is causal. Those remain measurement and business decisions.
Linear attribution checklist
Before using linear attribution for budget or reporting decisions, validate the measurement inputs as carefully as the model itself. A transparent formula does not protect the report from bad identities, missing touchpoints, or inconsistent conversion definitions.
- The conversion event is correctly defined.
- The conversion or revenue value is correct.
- The lookback window matches the buying cycle.
- Campaign and UTM naming is consistent.
- Anonymous and known activity connects correctly where possible.
- Repeated interactions are understood rather than ignored.
- Important offline interactions are included where possible.
- Direct-traffic treatment is clear.
- Stakeholders understand that equal credit is not causal influence.
A structured attribution checklist helps teams validate identity, conversions, windows, campaign data, and downstream outcomes before model differences become budget decisions.
Final verdict
Linear attribution is one of the easiest multi-touch models to understand because every eligible interaction receives an equal share of conversion credit.
Its simplicity is also its limitation. Equal weighting improves journey visibility, but it can flatten differences between high- and low-impact interactions, repeated channel touches, and missing data.
The strongest way to use linear is as a transparent baseline. Compare it with first-touch, last-touch, U-shaped, and time-decay views to see how much of your channel story depends on the model itself.
Ready to see Usermaven in action? Explore the platform or book a demo for a closer look.
Unlock insights that drive growth
FAQs
1. What is a linear attribution model?
A linear attribution model is a multi-touch attribution method that divides conversion credit equally across every eligible touchpoint in the customer journey. If four touches qualify, each receives 25% of the credit.
2. How does the linear attribution model calculate credit?
Linear attribution divides 100% of conversion credit by the number of eligible touchpoints. The basic formula is 100% ÷ N, where N is the number of touches included in the attribution window.
3. What is the formula for linear attribution?
For conversion credit, use 1 ÷ number of eligible touchpoints. For percentages, use 100% ÷ number of eligible touchpoints. For revenue, divide the conversion revenue by the number of eligible touches.
4. What is an example of linear attribution?
If a $300 order follows a Meta ad, an email, and a Google Search interaction, each of the three eligible touches receives 33.33% of the credit and $100 of attributed revenue.
5. What are the advantages of linear attribution?
Linear attribution gives visibility to the full eligible journey, is easy to calculate, requires little data, and provides a transparent benchmark when teams want to move beyond first-touch or last-touch reporting.
6. What are the disadvantages of linear attribution?
The model assumes every eligible interaction deserves the same weight. It can therefore over-credit repeated low-value touches, flatten differences in intent, and redistribute more credit to remaining interactions when tracking data is missing.
7. When should you use a linear attribution model?
Updated

Written by
Adeel Khan
Growth Marketing Expert
Adeel Khan is a full-stack SaaS marketer with 10+ years of experience in content marketing, paid advertising, analytics, and conversion rate optimization. He shares practical insights and strategies drawn from hands-on experience, helping B2B SaaS marketers improve performance and make better marketing decisions.
All articles by Adeel →