To calculate incrementality, subtract the control group’s conversion rate from the treatment group’s rate. That gives absolute lift in percentage points.
Divide the difference by the control rate for relative lift, or multiply it by the eligible treatment population to estimate additional conversions.

For example, one campaign can show 200% relative lift while 66.7% of treatment conversions are estimated to be incremental. Both results can be correct because the denominators answer different questions.
This guide provides the four formulas, a worked example with unequal group sizes, an interactive calculator, and a downloadable worksheet. The calculation describes observed differences; a causal conclusion still depends on a trustworthy experiment.
Key takeaways
- Start with rates: Divide unique converters by all eligible assigned participants in each group.
- Absolute lift: Subtract the control conversion rate from the treatment rate and report percentage points.
- Relative lift: Divide the rate difference by the control rate to express improvement over baseline.
- Incremental conversions: Normalize the control rate to the treatment population before subtracting outcomes.
- Incremental share: Divide the lift by the treatment rate, not the control rate.
- Validity matters: Correct arithmetic cannot repair biased assignment, missing events, or an unsuitable test design.
How to calculate incrementality at a glance
Let T be the treatment conversion rate, C the control conversion rate, and Nₜ the number of eligible treatment participants. Use decimal rates inside formulas: 1.5% is 0.015. Multiply ratios by 100 only when presenting a percentage.
| Result | Formula | Reporting unit |
|---|---|---|
| Treatment conversion rate | Treatment converters ÷ treatment participants | % |
| Control conversion rate | Control converters ÷ control participants | % |
| Absolute lift | T − C | Percentage points |
| Relative lift | (T − C) ÷ C | % |
| Incremental conversions | (T − C) × Nₜ | Conversions |
| Incremental share | (T − C) ÷ T | % |
Important: Relative lift is undefined when C = 0; incremental share is undefined when T = 0. Negative results are possible. These formulas estimate differences, not statistical significance.
Use the free incrementality calculator
Enter the eligible treatment and control populations and the number of unique converters in each. The calculator returns absolute lift, relative lift, normalized incremental conversions, and incremental share, with a separate explanation for each result.
Interactive calculator placement
Incrementality calculator
Enter the eligible participants and unique converters for each group. Revenue and spend are optional.
Enter assigned participants and converters
The denominator is the complete eligible assigned population, not only the people who clicked or saw an advertisement. When the randomized design calls for intention-to-treat analysis, keep participants in their original assigned groups.
Read the outputs independently
The calculator distinguishes the percentage-point difference from relative percentage lift. It also adjusts the control outcomes to the treatment population, which prevents a common error when group sizes are unequal.
Add revenue only when definitions match
Optional fields accept treatment revenue, control revenue, and relevant advertising spend. Revenue is normalized per eligible participant before estimating incremental revenue. The cost denominator for incremental ROAS depends on the spending intervention being tested.
A companion Excel worksheet lets analysts save the same inputs with their experiment notes. The download link should point to the WordPress Media Library copy of the worksheet after upload.
What data do you need before calculating?
A trustworthy calculation starts with a defined experimental unit, stable assignment, and one consistent outcome. For a binary conversion rate, count unique eligible people who converted, not the total number of purchases from those people.
Count assigned participants, not impressions
Someone assigned to receive advertising may never see an ad. Comparing only exposed customers with unexposed customers can introduce selection bias, even when the original assignment was randomized.
Check whether the groups are comparable
Randomization, cross-channel spillover, and missing records can change the interpretation. Our incrementality testing framework explains how to document assignment, contamination, power, and the analysis plan before trusting a lift estimate.
| Required input | What to record or verify |
|---|---|
| Assignment unit | Person, account, household, or market; use one stable ID |
| Population | Eligible assigned units in each group, including nonconverters |
| Outcome | One defined conversion per unit, or a separately specified count metric |
| Observation window | Consistent event dates, lag, and exclusions |
| Data QA | Deduplication, assignment integrity, and missing outcomes |
How to calculate incremental lift step by step
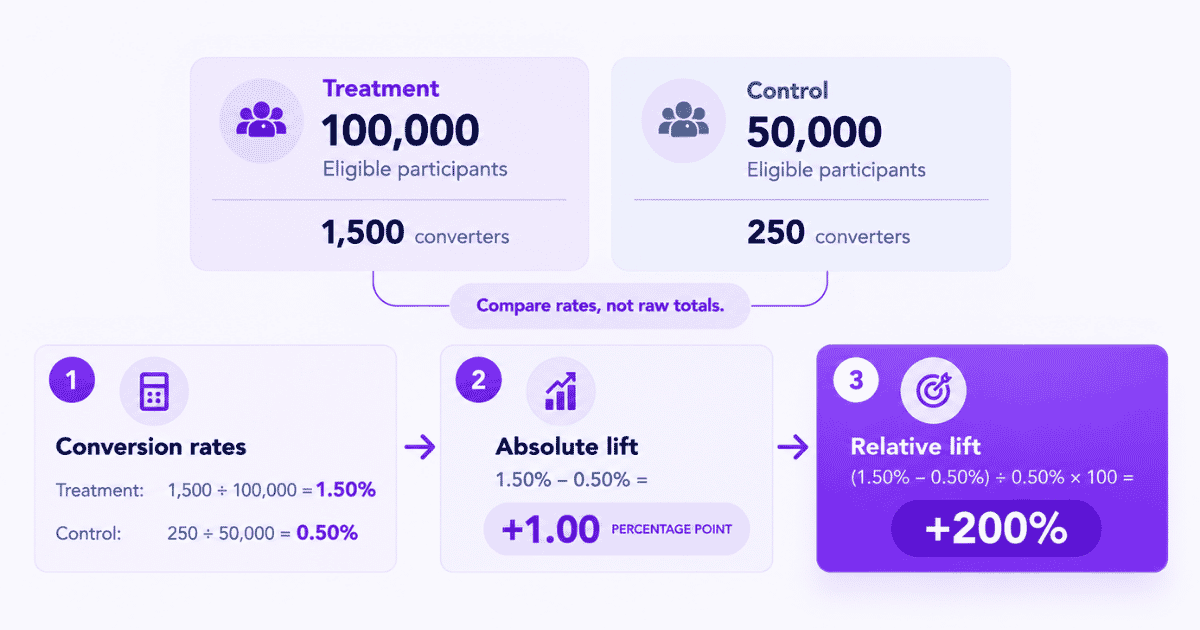
Consider an illustrative randomized retargeting experiment with different treatment and control population sizes. The example assumes consistent conversion definitions, stable assignment, and comparable observation periods.
| Measurement | Treatment | Control |
|---|---|---|
| Eligible participants | 100,000 | 50,000 |
| Unique converters | 1,500 | 250 |
| Conversion rate | 1.50% | 0.50% |
Step 1. Calculate both conversion rates
Treatment: 1,500 ÷ 100,000 = 1.50% | Control: 250 ÷ 50,000 = 0.50%
Calculate both rates using every eligible person in the corresponding assigned group. The difference between these rates, rather than between raw totals, is the starting point for the remaining formulas.
Step 2. Calculate absolute lift
Absolute lift = 1.50% − 0.50% = +1.00 percentage point
This is a difference of one percentage point. Saying “1% lift” would be ambiguous because readers might interpret it as a 1% relative improvement.
Step 3. Calculate relative lift
Relative lift = (1.50% − 0.50%) ÷ 0.50% × 100 = +200%
The treatment conversion rate is three times the control rate, or 200% higher relative to the control baseline. Relative lift is not the estimated fraction of treatment conversions that were additional.
How to normalize unequal test groups
The treatment group contains twice as many eligible participants as the control group. Subtracting raw conversions would compare unequal populations and exaggerate the estimated increment for the treatment population.
Step 4. Scale control outcomes to treatment size
Expected treatment-sized control conversions = 0.005 × 100,000 = 500
The 0.50% control conversion rate implies about 500 conversions among 100,000 eligible people under control conditions, assuming the rate is applicable to the treatment population.
Step 5. Estimate incremental conversions
Estimated incremental conversions = 1,500 − 500 = +1,000
Simply subtracting 250 from 1,500 would produce 1,250, an invalid raw-count comparison for unequal group sizes. The normalized result estimates 1,000 additional treatment-group conversions.
This is a population-level estimate; it does not reveal which particular customers changed behavior. The broader role of incrementality in marketing is to estimate outcomes that would not have occurred under the tested control condition.
Relative lift vs. incremental share
Marketers sometimes encounter a 200% lift figure in one report and a 66.7% incrementality figure in another. Both can describe this experiment, provided each is correctly labeled.
Step 6. Calculate incremental share
Incremental share = 1,000 ÷ 1,500 × 100 = 66.7%
Equivalently, divide the rate difference by the treatment rate: (1.50% − 0.50%) ÷ 1.50%. This estimates the share of treatment conversions attributable to the tested intervention under the experimental assumptions.
| Measure | Result | Denominator |
|---|---|---|
| Absolute lift | +1 percentage point | Difference in rates |
| Relative lift | +200% | Control rate |
| Estimated incremental conversions | +1,000 | Treatment population |
| Incremental share | 66.7% | Treatment conversions |
Before deciding which percentage to report, ask whether the stakeholder needs an improvement over baseline or a share of treated outcomes. Those are separate questions, not competing answers.
Unlock insights that drive growth
How to calculate incremental revenue
For monetary outcomes, compare revenue per eligible participant, then scale the control amount to the treatment population. Do not subtract raw revenue totals when the assigned populations have different sizes.
Incremental revenue = Treatment revenue − (Control revenue ÷ Ncontrol × Ntreatment)
Suppose these same population sizes generate $80,000 in treatment revenue and $30,000 in control revenue. The normalized control baseline is $30,000 ÷ 50,000 × 100,000 = $60,000, giving $20,000 in estimated incremental revenue.
The revenue effect is a separate outcome from incremental conversion count, so it need not equal the conversion effect multiplied by a fixed order value. Our incremental revenue resource explains baseline and revenue-definition choices in more detail.
An attribution report can assign credit to recorded touchpoints without establishing a counterfactual. The distinction in incrementality vs. attribution becomes important before using campaign credit as the numerator in a lift calculation.
How reliable is the calculated lift?
A calculator returns a point estimate. It cannot determine whether assignments were valid, participants were independent, or uncertainty is narrow enough for the decision. Confidence intervals and statistical tests must match the experiment’s actual design.
For independent user-level binary outcomes, analysts may estimate uncertainty around the difference in conversion rates. Geo experiments, cluster-randomized designs, repeated observations, and multiple interim looks can require different methods.
Statsig’s explanation of experiment results distinguishes relative lift from its confidence interval and cautions against decision-making on immature or incomplete test results.
| Situation | What it means | Recommended response |
|---|---|---|
| Positive lift, wide interval | Effect may be imprecise | Report uncertainty; avoid automatic scaling |
| Negative lift, wide interval | Direction is not reliable | Investigate and collect sufficient evidence |
| Control rate = 0 | Relative lift undefined | Report absolute change and seek statistical review |
| Unexpected assignment ratio | Potential sample-ratio mismatch | Audit assignment and missing events |
| Duplicated converters | Conversion rate inflated | Deduplicate unique units before computing |
As Eppo’s sample-ratio mismatch guidance explains, unexpected allocation differences can indicate broken assignment or logging. A valid 2:1 randomization is not itself a mismatch; the observed ratio must be compared with the planned assignment ratio.
If assignment validity or experimental feasibility remains uncertain, use the broader marketing measurement approach to separate descriptive reporting from credible causal inference.
Common incrementality calculation mistakes
Many mistakes occur before the final subtraction. Check the population and metric definitions as carefully as the formula.
| Mistake | Correct approach |
|---|---|
| Subtracting raw totals across unequal groups | Normalize the control rate to treatment population |
| Calling +1 pp “+1% relative lift” | Label percentage-point and percentage metrics separately |
| Using treatment denominator for relative lift | Label this as incremental share instead |
| Counting repeat orders as unique converters | Deduplicate people or define a count-based metric |
| Ignoring zero or negative results | Display undefined ratios and negative lift accurately |
| Using attributed revenue as the control | Estimate a credible counterfactual |
| Mixing outcome windows or currencies | Align the scope before calculation |
| Treating output as causal proof | Audit design and experiment-appropriate inference |
The paid ads attribution view is useful for investigating recorded campaign credit, but its attributed conversion totals are not a substitute for an experiment’s control outcomes.
How to collect consistent experiment data
Reliable results require that assignment and conversion data refer to the same eligible units. A recording workflow helps enforce that consistency, but the randomized assignment must be performed by the experimentation system.
Record group assignment before outcomes
Usermaven’s A/B test tracking documentation describes recording externally assigned variants through an `ab_test_assigned` custom event with `test_name` and `variant` properties. Maintain stable participant identifiers, and preserve both converters and nonconverters in the eligible population.
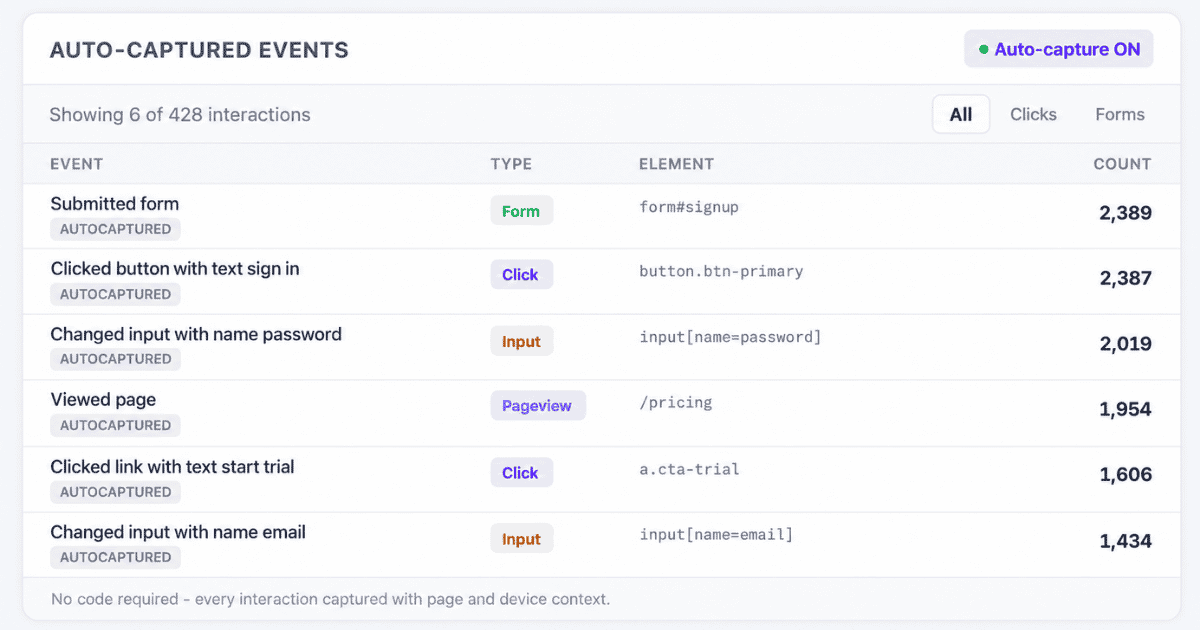
Teams can instrument important actions using event tracking setup and organize those actions through the Events interface. These records can be checked against the original external assignment ledger.
Use the same definition for both groups
A conversion goal should correspond to the same outcome and observation window in treatment and control. Counting only events attributed to a campaign would exclude some eligible outcomes and distort the intended comparison.

The Measurement Trust Center can flag campaign-collection and integration issues, while Funnels helps explain descriptive behavior between actions. Neither feature validates randomization or replaces experiment-specific statistical inference.
Recommended measurement chain: External assignment → `ab_test_assigned` → conversion event → unique group totals → calculator → design-appropriate statistical analysis.
What should you do with the result?
Compare the calculated effect with the business decision and the test’s predeclared success threshold. A positive point estimate with substantial uncertainty is not a reliable instruction to raise spending.
For revenue-focused decisions, analysts may translate a credible causal estimate into a spending-efficiency metric. Cost and profitability questions belong to a separate iROAS analysis rather than this conversion-lift calculator.
If the result conflicts with expectations, first verify event quality, assignment integrity, and metric definitions. Repeating a test without investigating those conditions can reproduce the same measurement error.
Final verdict
Calculating incrementality requires the right denominator as much as the right formula. Begin with comparable treatment and control rates, normalize unequal groups, and distinguish relative lift from incremental share.
Then assess whether the experiment supports a causal conclusion before changing budgets.
Reliable comparison also depends on connected conversion and campaign data. To understand how Usermaven helps organize those measurements, book a demo.
FAQs
1. How do you calculate incrementality percentage?
For relative lift, subtract the control conversion rate from the treatment rate and divide by the control rate. For incremental share, divide the same difference by the treatment rate. Always label the denominator.
2. What is the difference between incremental lift and incremental share?
Relative incremental lift reports improvement over the control baseline. Incremental share estimates the portion of treatment conversions attributable to the intervention. They can produce very different percentages from the same experiment.
3. How do you calculate incrementality with unequal group sizes?
Calculate each group’s conversion rate, multiply the control rate by the treatment population, and subtract that normalized expectation from treatment conversions. Do not subtract the groups’ raw conversion totals.
4. Can incrementality be negative?
Yes. If the treatment conversion rate is lower than the control rate, absolute lift and estimated incremental conversions are negative. The uncertainty and validity of the experiment still determine what can be concluded.
5. Does the calculator prove that advertising caused conversions?
No. The calculator performs arithmetic on entered outcomes. Causal interpretation requires credible assignment, consistent measurement, limited contamination, and suitable statistical analysis for the experimental design.
Updated

Written by
Junaid Ahmed
Content Writer & Digital Marketer
Junaid Ahmed is a content and copywriter with 3+ years of experience creating research-driven content across SaaS, B2B, ecommerce, and digital marketing. He specializes in turning complex topics into clear, practical content that helps marketers better understand their challenges, evaluate solutions, and make informed decisions. His work spans educational content, industry insights, and actionable marketing guides.
All articles by Junaid →