Build vs. buy analytics usually starts as a quick thought in a sprint planning doc. Then it becomes a real decision: your product is shipping, your data is growing, and people want answers across the customer journey.
One direction gives you a system shaped exactly around your product. The other gives you a ready-made setup with fewer moving parts to manage.
Both can work. The real question is what you want to own, what you want to borrow, and how quickly you want the answers to show up.
Let’s get clear on what “build” and “buy” really mean, before you pick a path that shapes everything after.
What does it mean to build vs. buy?
Build vs. buy analytics is basically a question of ownership.
Building analytics means creating your own tracking and reporting setup instead of using an off-the-shelf platform.
You decide what events exist, how they’re collected, where they’re stored, and how they show up in reports. You’re basically designing your own analytics system from the ground up, even if you use a few tools along the way. For example, Airbnb built Minerva, an internal metrics platform designed to standardize how teams define and use metrics across the company.
Buying analytics means adopting a platform with that system already in place, such as Usermaven or other analytics platforms built for teams that want usable reporting without building the whole stack.
You still define the events you care about. But instead of building and maintaining the reporting layer yourself, you’re working inside a product that turns incoming events into ready-to-use reports.
Here’s a simple example.
If you want analytics so teams can quickly answer questions like “which channel drives signups?” and “where do users drop off?”, buying is usually the right move.
If you need analytics to calculate a core metric using your own rules, such as “qualified activation,” which depends on several backend conditions, building is often the better fit.
💡 Quick note: If you’ve ever seen teams use “reporting” and “analytics” interchangeably, our reporting vs. analytics guide breaks down the difference in a simple way.
The real difference between building and buying
Here’s what you’re actually taking on with each path.
| Area | Building analytics | Buying analytics |
| Ownership | You own the system and upkeep | You use a system that’s maintained for you |
| Setup time | Longer, often staged over weeks/months | Faster path to usable reporting |
| Ongoing effort | Continuous engineering + maintenance load | Lower operational overhead |
| Cost profile | Hard to predict: engineering hours, tool costs, data team dependency | More predictable subscription-style cost |
| Flexibility | Full control and custom fit | Some limits based on the platform |
| Reporting speed | New questions often mean new work | Built-in reports handle most repeat questions |
| Adoption | Often depends on a few technical owners | Easier self-serve across teams |
Building analytics
Building makes sense when you’re comfortable owning analytics like a long-term system, with all the follow-on work that comes with it.
Pros
- Full control. You set the rules for events, identity, and data structure.
- Custom fit. You can shape everything around your product and workflows.
Cons
- You don’t just build it once. Every new feature adds tracking work, and every product change can break reporting.
- Reporting takes longer than expected. Collecting events is step one. Making them useful for non-technical teams is the real lift.
- Maintenance is constant. Pipelines, permissions, documentation, versioning, monitoring, backfills.
- The cost is hard to pin down upfront. It starts small, then grows through engineering hours, tool costs, a rising maintenance load, and increasing data team dependency as edge cases and “quick fixes” pile up.
- It’s easy to end up with a system only a few people understand. And that limits adoption, even if the data is technically there.
When “build” makes sense
Building makes sense when you want analytics to be an internal capability you own long term. You have someone responsible for keeping definitions clean, maintaining the pipeline, and updating tracking as the product changes.
It’s also the better fit when your event model or identity rules are genuinely unique, and you already know a standard platform will force awkward workarounds.
Buying analytics
Buying makes sense when you want a working analytics system your team can use without first rebuilding the foundations.
Pros
- Faster time-to-value. You can go from tracking to usable reporting without months of setup.
- Lower operational overhead. Maintenance, updates, uptime, and performance are handled for you.
- Built-in analysis patterns. Funnel analysis, retention, conversion paths, and analytics dashboards are ready to use.
- Easier adoption across the company. More people can self-serve without waiting for custom queries.
- Advanced capabilities without extra projects. You get features that would otherwise become separate internal builds.
- GSC inside the analytics dashboard. Search performance and on-site behavior can live in the same view, so SEO reporting doesn’t sit in a separate workflow.
Cons
- You’re working inside a platform. There will be limits around customization and how things are modeled.
- Vendor dependency is real. Pricing, roadmap, and support become part of the deal.
When “buy” makes sense
Buying makes sense when you want a system the team can use quickly without creating another ongoing engineering responsibility. The goal is repeatable reporting that stays usable as you ship, not a custom stack that needs constant care.
It’s usually the cleaner choice when you want broad adoption across product and marketing, and you don’t want every new question to turn into a custom request.
Why most teams end up buying
Here’s what usually happens.
A team builds the first version, it works, and everyone moves on. Then the ongoing commitment shows up: new events, renamed fields, backfills, and the “quick question” that turns into a weekly request.
That’s the real trade. You’re not building analytics once. You’re taking responsibility for keeping it accurate as the product keeps changing.
Buying changes that commitment. You still own what matters, like the tracking plan and the questions you want answered. But you’re no longer responsible for maintaining the entire pipeline and reporting layer.
- You avoid the invisible tax: The ongoing engineering time spent maintaining pipelines, fixing edge cases, and rebuilding reports after product changes
- You get depth without the build queue: Funnels, journeys, cohorts, and advanced reporting without having to design and maintain every layer.
- You see value sooner: The system is ready for questions as soon as the events land.
How to pick the right setup when buying analytics
“Buying” doesn’t mean there’s only one kind of setup. You’re still making a couple of choices up front that shape how the tool fits into your stack.
Self-hosted vs. cloud-based
With self-hosted, you run the analytics tool on your own infrastructure. Your team manages the environment, upgrades, uptime, and security settings.
With cloud-based, the vendor hosts it. You connect your product, send events, and use the platform without running the underlying system yourself.
A simple way to think about it:
- Self-hosted: more control over where data lives and how the system is operated
- Cloud-based: less operational work and a faster path from setup to usable reports
Low-code vs. no-code
The second choice is how much setup work you want the tool to handle: low-code or no-code.
With no-code, the goal is to get useful reporting with minimal implementation. You add a snippet or SDK, define a few key events, and most of the work happens in the UI.
With low-code, you still get a product, but it requires more hands-on setup. You might write a bit of code to shape events, define custom properties, or connect data sources the way you want.
In practice, the split looks like this:
- No-code analytics tools lean on automatic capture and UI configuration
- Low-code tools lean on instrumentation and developer-defined events for accuracy and flexibility
Build vs. buy decision framework
A good build vs. buy decision framework is not a scoring exercise. It is a way to make the tradeoffs visible before you commit.
You are choosing what you want to own for the next year, not what you can ship in the next sprint.
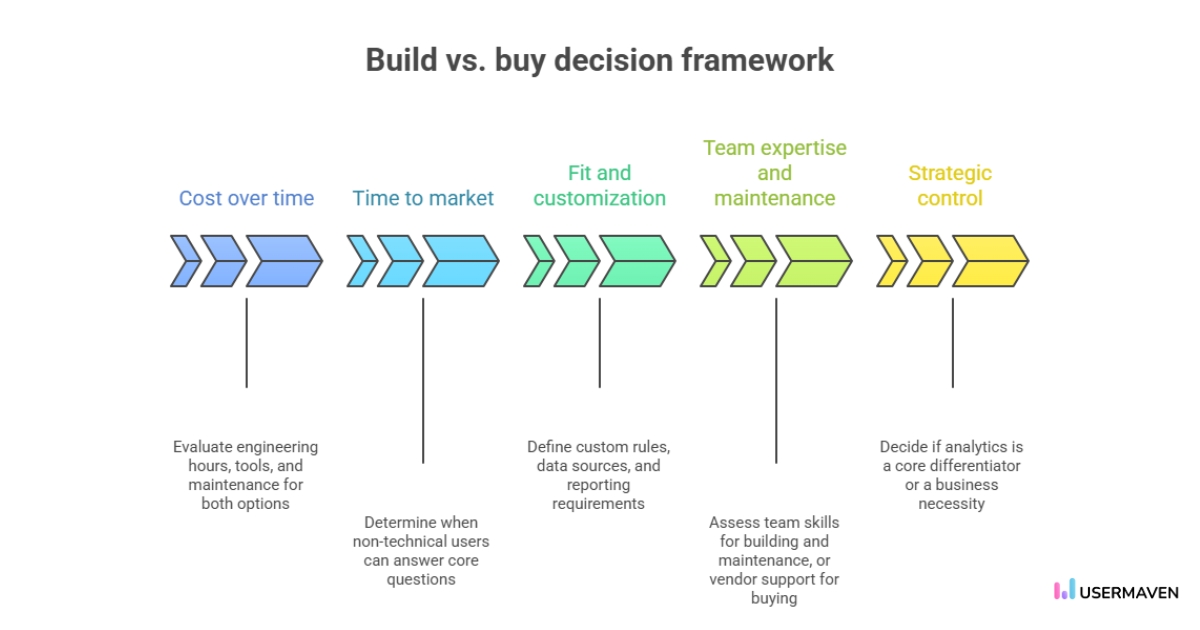
- Cost over time
Don’t compare “build effort” to a subscription. Compare total ownership. Count engineering hours, extra tools you’ll need (warehouse, BI, pipelines), and the ongoing maintenance load that comes with changes and backfills. - Time to market
Ask one concrete question. When will a non-technical teammate be able to answer core questions without waiting on custom work? Buying often gets you there faster. Building usually comes later, after the reporting layer is in place. - Fit and customization
Be specific about what “fit” means. Do you need custom identity rules, unusual data sources, or reporting that doesn’t map to standard funnels and journeys? If not, you’re probably paying a build tax for flexibility you won’t use. - Team expertise and maintenance
Building requires an owner who can keep tracking stable release after release. If ownership rests with a single data person or an engineer, expect bottlenecks. Buying reduces the upkeep, but you still need someone to own the event definitions and naming rules. - Strategic control
One filter works well here. Does analytics directly differentiate your product, or is it a foundation you need to run the business? If it’s differentiation, build can make sense. If it’s a foundation, buying is usually the cleaner path.
Critical questions for your build vs. buy decision framework
A build vs. buy decision gets much easier when you stop debating tools and start pressure-testing the choice.
These questions are designed to do that.
- What outcome are we trying to change by choosing build or buy?
- If we were starting fresh today, would we still choose the same path?
- If this works extremely well, what new complexity shows up next?
- If it doesn’t work, what fails first: the tech, the data, adoption, or ownership?
- Which roles take on new responsibilities if we build instead of buy?
- What do we only learn by building that we can’t learn by buying?
- If a competitor bought this tomorrow, would building still feel necessary?
- What small test could make the decision obvious in the next few weeks?
- Are we choosing for today’s team structure or the org we expect later?
- Where do we need deep control, and where is “good enough” acceptable?
- If a vendor changed pricing or direction, how hard is it to switch?
- How does this choice change what our strongest people spend time on?
- Which customer segment actually cares if this is exceptional?
- Does this push us toward AI-first work, or keep AI as an add-on?
How AI is changing the build vs. buy strategy
AI has not just made building faster. It has changed what “build” and “buy” even mean.
You can get a prototype running quickly now. The harder part is proving it stays accurate when the product changes and more people rely on the numbers.
Speed
In a build vs. buy in the age of AI, speed is less about shipping something and more about learning whether it holds up.
AI makes it easy to create a first pass. The real bottleneck becomes evaluation. Can the system answer the same question the same way, week after week?
Cost
AI also changes cost in a way most spreadsheets miss.
Analytics implementation cost is no longer just the build. It includes the follow-on work that keeps the system trustworthy. Monitoring, fixes, backfills, identity rules, and all the small updates that add up.
A make vs. buy analysis should treat those as real costs, not rounding errors.
Capability and quality
AI can generate insights quickly, but quality still depends on inputs.
If your events are inconsistent or your identity rules are fuzzy, AI will produce confident output that is hard to trust. The more automation you add, the more your analytics infrastructure needs clean definitions underneath.
Data and governance
AI raises the stakes on where data lives and who controls it.
If you have strict requirements around access, retention, or sensitive data, that will push you toward more in-house ownership. If your priority is reliable reporting without running the whole stack, in-house analytics vs. SaaS analytics becomes a trade-off in operational load.
Integration and evolution
The last shift is how systems evolve.
Buying used to mean adopting a tool and integrating it once. In the AI era, tools change faster. Models update, product behavior changes, and the “right” definition of an event get revisited more often.
That is also where product analytics vs. marketing analytics can split. Marketing wants fast answers by channel. Product wants stable definitions tied to in-app behavior. AI makes both easier, but only if the underlying system stays consistent across teams.
How Usermaven fits for teams that choose to buy
If you’re buying analytics, you’re making a simple trade: less time building the system, more time using it.
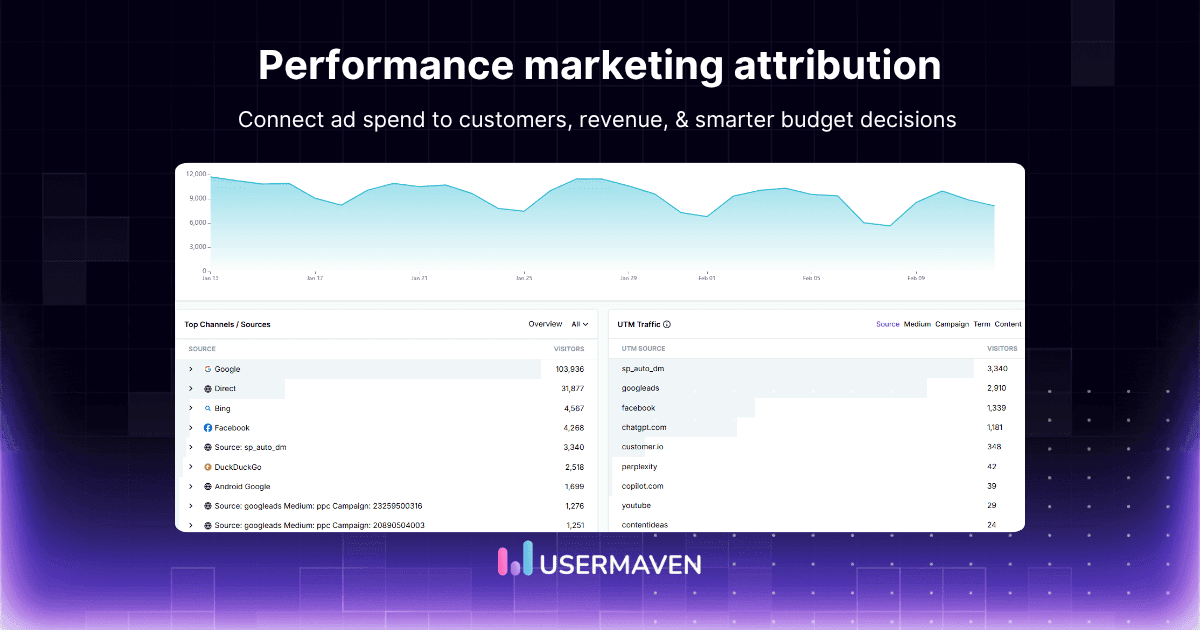
Usermaven is built to do exactly that. It’s a no-code analytics and attribution tool, so you can start collecting useful data without turning tracking into an engineering project.
The workflow is simple: add the tracking script, and let the platform automatically capture common actions (pageviews, clicks, and more).
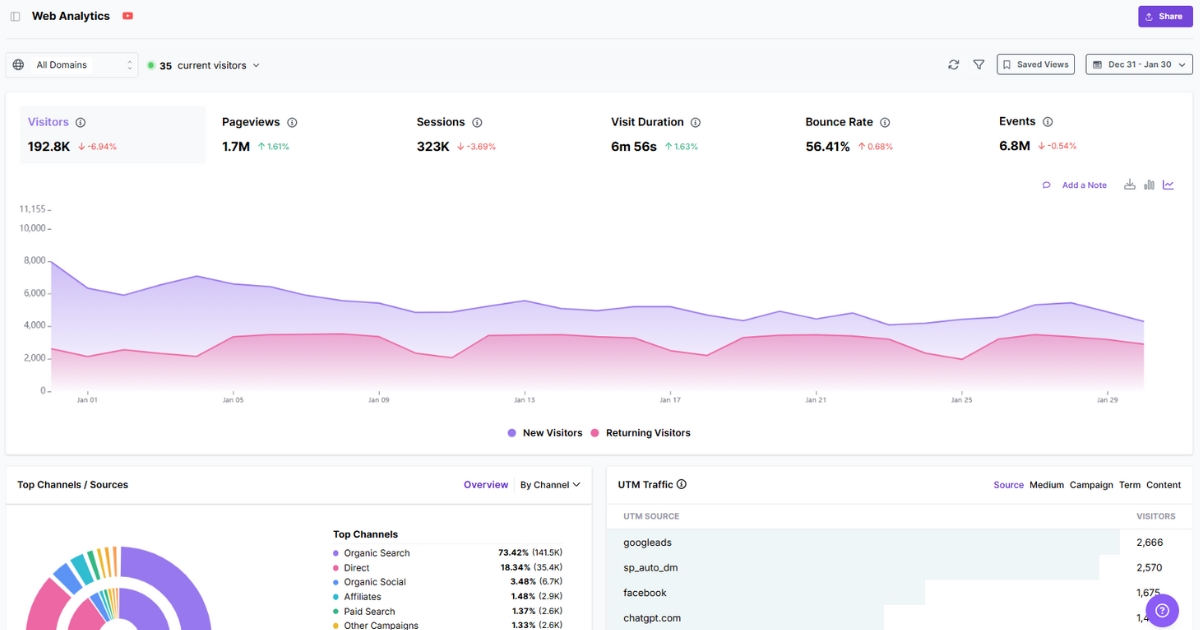
This is what you get in a setup like this:
- Automatic tracking as the default, with custom events when you need to capture specific actions (signup milestones, key feature usage, upgrades).
- Product and website analytics in one place, so you’re not stitching together basic reporting across tools.
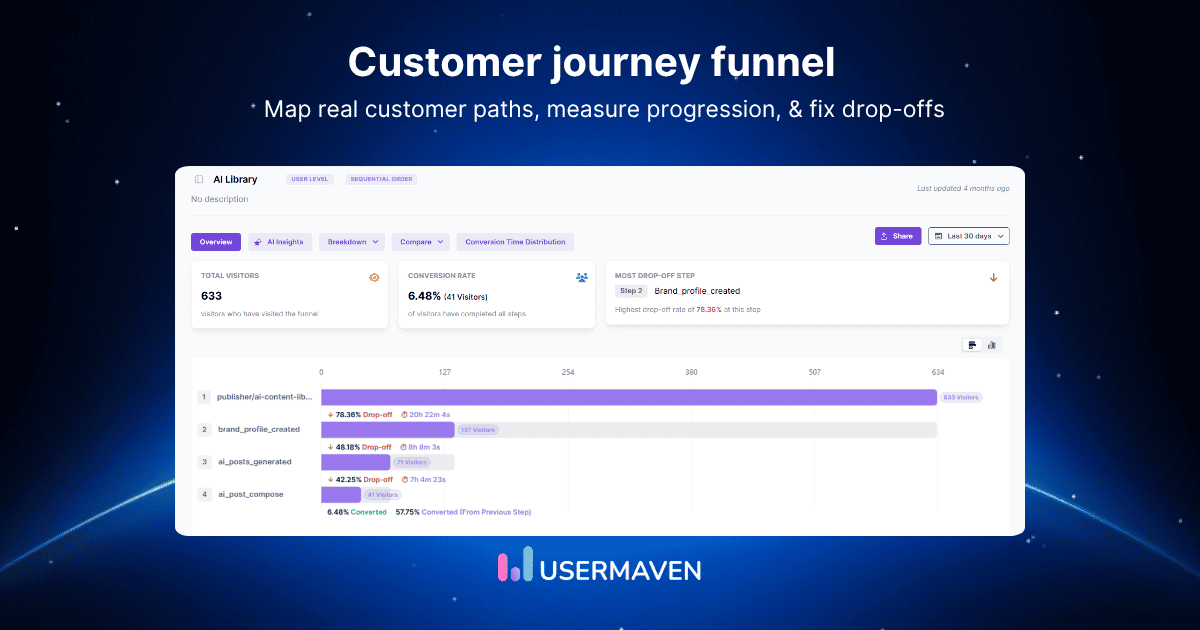
- Funnels and user journeys to see both the drop-off points and the paths people take around them.
- Advanced attribution software with multiple models to keep reporting consistent across teams.
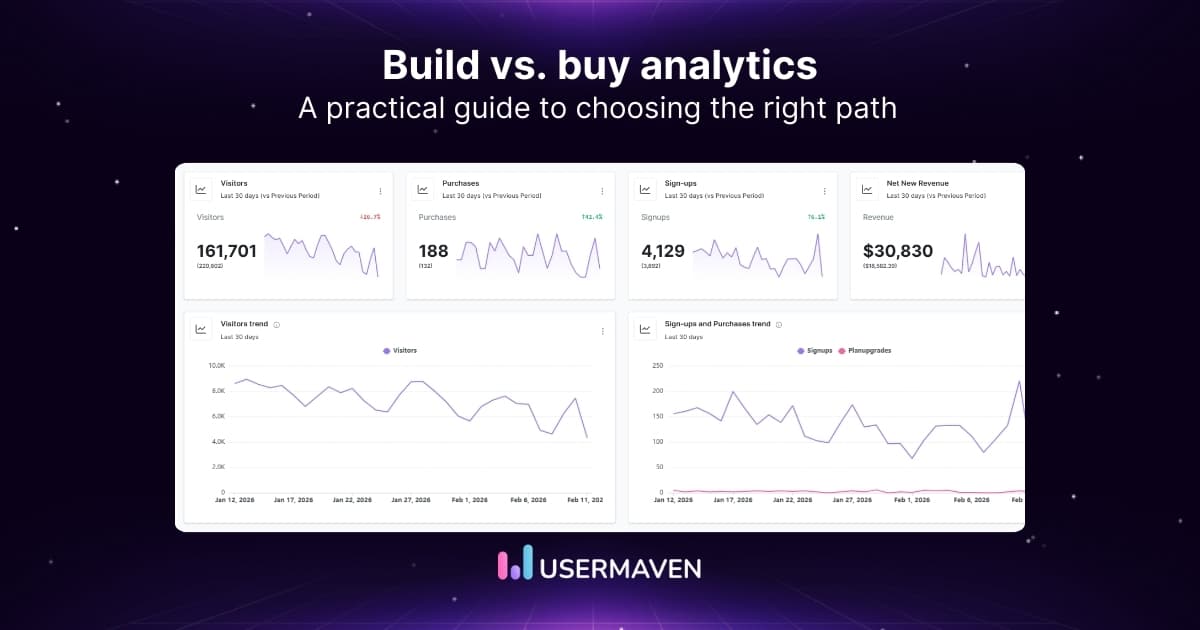
- Customizable dashboards that you can share internally, without rebuilding the same views for every team.
- White label analytics for agencies or teams that want client-facing reporting under their own brand.
And if you’d rather not figure out the setup on your own, there’s a guided setup and tracking plan add-on designed to help you implement it correctly from the start.
Wrapping up
The build vs. buy analytics conversation is only worth having if it ends with a setup people trust.
Pick the path that keeps your tracking consistent, your reporting usable, and your team spending time on questions that change decisions, not chores that keep the data alive.
And when the goal is to connect marketing effort to real outcomes, that’s where Usermaven earns its spot. As a powerful marketing attribution tool, it gives you a clear line from touchpoints to conversions, so you can defend what’s working and double down with confidence.
Ready to see Usermaven in action? Explore the platform or book a demo for a closer look.
FAQs
1. How do I compare build vs. buy without turning it into a months-long project?
Pick one key flow (signup → activation → upgrade) and evaluate both options against that. If you can’t answer those questions cleanly, the full setup won’t get easier later.
2. What’s the difference between “building analytics” and “building reports”?
Building analytics means owning the end-to-end system, including how events are collected and maintained. Building reports usually means the data already exists somewhere, and you’re only creating views on top of it.
3. What is a buy vs. build strategy?
It’s a hybrid approach. You buy an analytics tool for the core system, then build only the pieces you need on top (custom events, extra data sources, internal reporting).
4. What is make vs. buy analysis?
It’s a structured way to decide whether to build or purchase by comparing ownership, implementation time, and ongoing maintenance effort for each option.
5. Is it cheaper to build analytics in-house?
Sometimes upfront, yes. Over time, the ongoing engineering and maintenance hours often outweigh the subscription cost for most teams.
6. When should a startup build analytics?
When it needs a very specific data model or workflow that off-the-shelf tools can’t support, and it has engineering time to maintain it as the product changes.
7. What are the risks of building analytics internally?
The main risks are data drift over time, hidden maintenance work, and reporting that becomes dependent on a few people who understand the system.
Updated

Written by
Ryan Mitchell
Marketing Analytics Strategist
Ryan Mitchell is a marketing analytics strategist specializing in campaign measurement, customer journeys, and marketing performance. He writes about analytics, reporting, and data-driven marketing strategies, helping SaaS and B2B teams measure what matters across every stage of the customer journey.
All articles by Ryan →