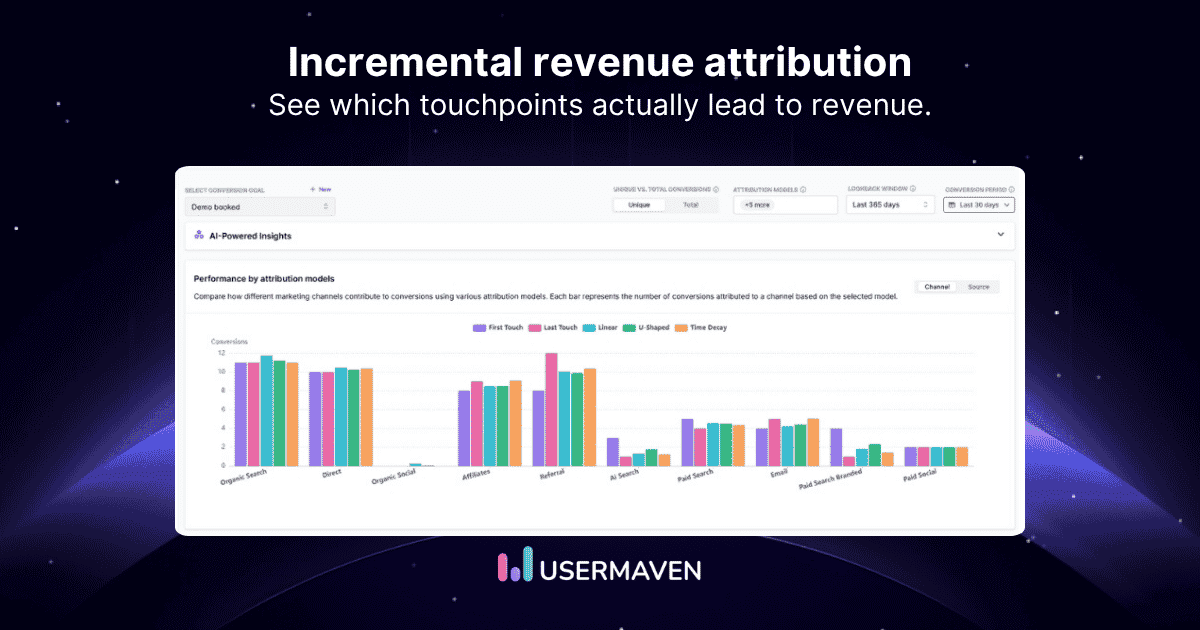
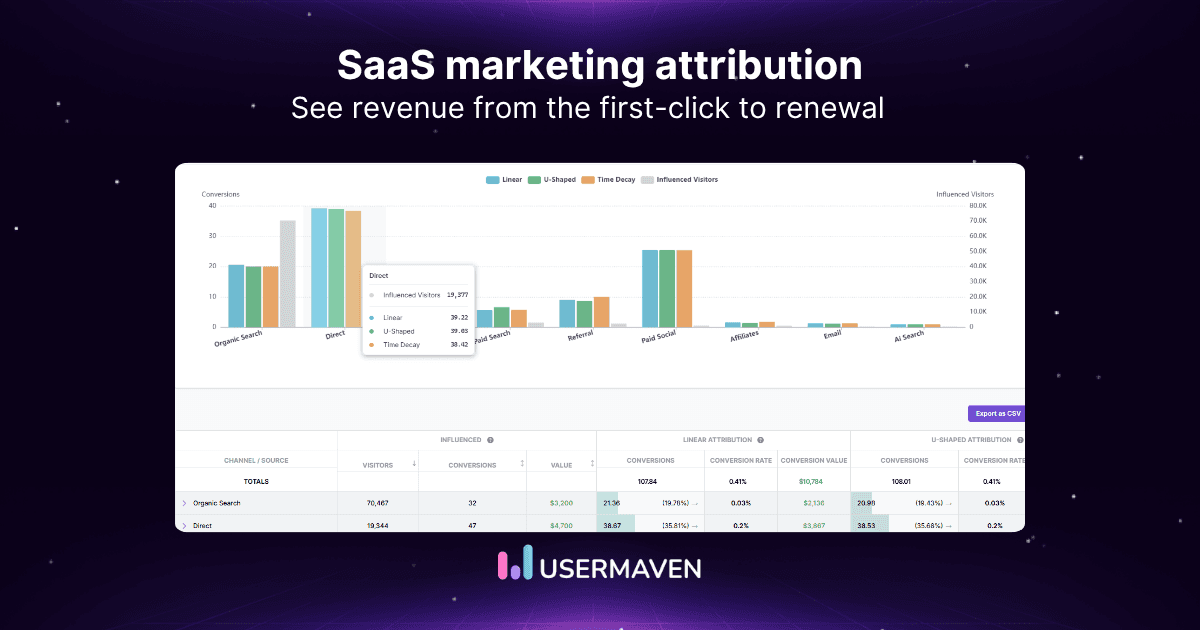
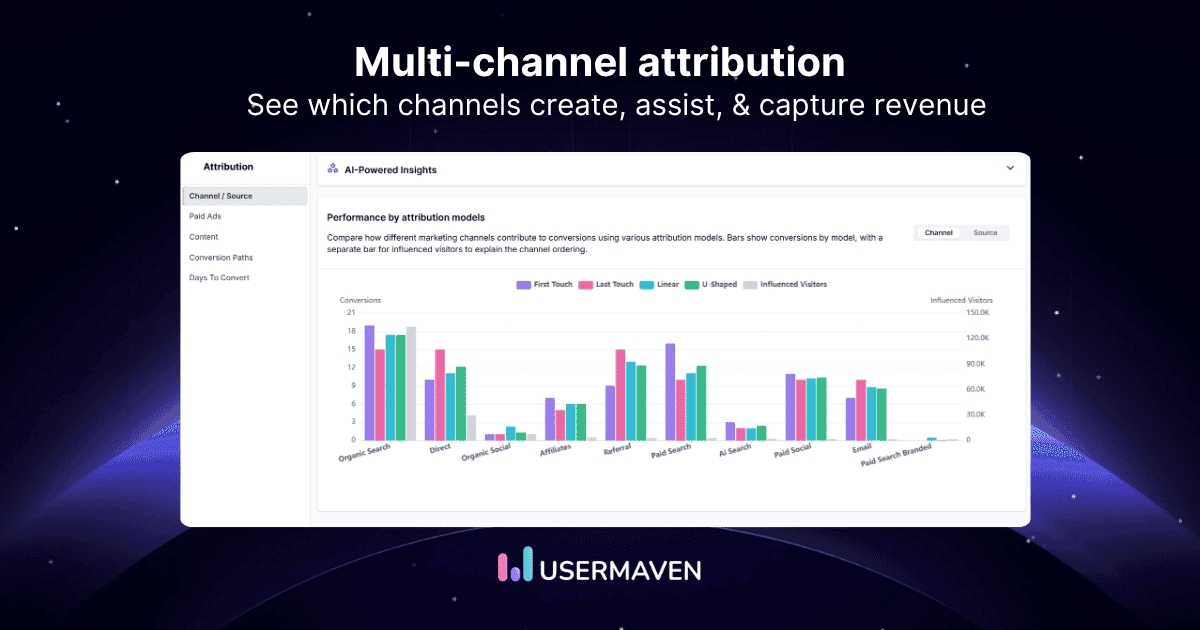
The campaign that generates the most leads can still generate very little revenue.
That is why marketing attribution software should not stop at clicks, forms, or signups. Revenue attribution follows the journey into opportunities, purchases, subscriptions, and Closed Won outcomes.
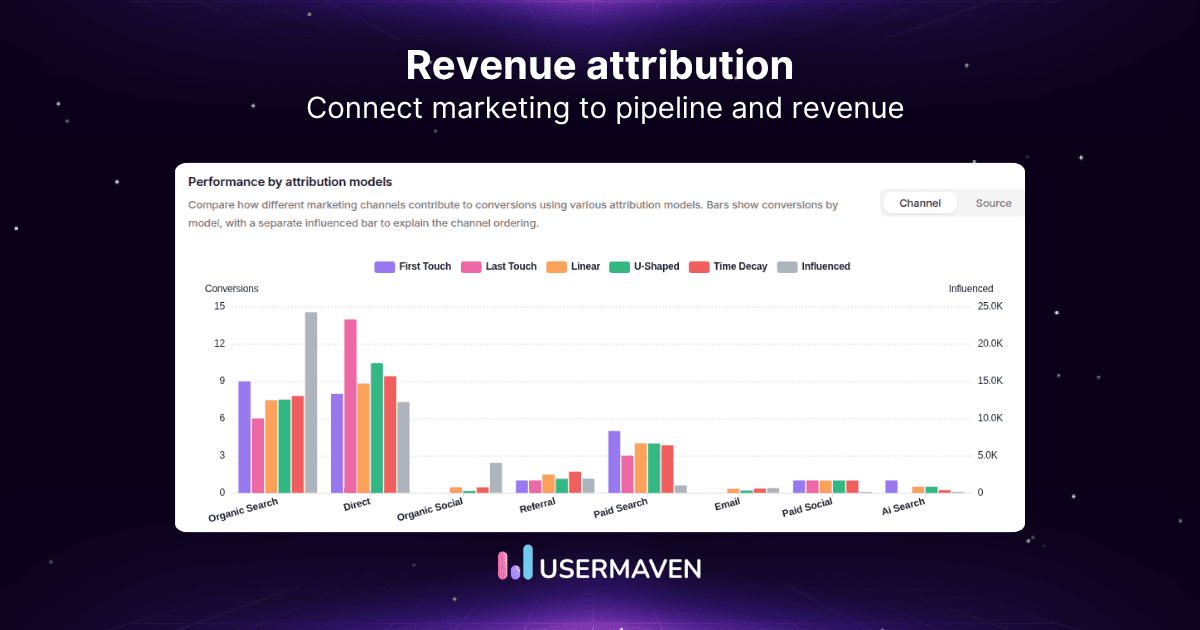
This guide shows how to define the revenue event, connect acquisition and behavior with CRM or payment data, choose a model, and validate the result before attributed revenue influences budget.
Revenue attribution at a glance
| What it is | Why it matters | What to look for |
|---|---|---|
| Revenue attribution assigns revenue credit to the marketing, sales, and customer interactions that contributed to a commercial outcome. | It connects marketing activity with pipeline, purchases, subscriptions, or Closed Won revenue so teams can evaluate channels by business impact. | Reliable source data, identity resolution, CRM or payment revenue, a defined attribution window, and a model that matches the business question. |
Core calculation: Attributed revenue = Revenue × attribution credit percentage.
Key takeaways
- Revenue must be defined first: Pipeline, ARR, purchase revenue, Closed Won value, and collected revenue are different outcomes. Agree on the revenue basis before assigning credit.
- Attribution can extend beyond leads: Revenue attribution connects marketing and customer interactions with a commercial result rather than ending measurement at a form submission.
- Models answer different questions: First-touch, last-touch, linear, time-decay, U-shaped, data-driven, and custom approaches distribute revenue credit differently.
- Data quality comes before modeling: Missing source data, broken identity, duplicate conversions, stale CRM records, or incorrect revenue values can make a sophisticated model unreliable.
- Pipeline and revenue are not interchangeable: A campaign can influence a large opportunity value and still produce no Closed Won revenue.
- Attribution does not prove causality: Crediting an observed touchpoint with revenue does not prove the revenue would disappear if that touchpoint were removed.
What is revenue attribution?
Revenue attribution is the process of assigning revenue credit to the marketing, sales, and customer interactions that contributed to a commercial outcome.
The outcome can be Closed Won revenue, a purchase, subscription value, ARR, ACV, expansion revenue, or another clearly defined monetary result.
It is best understood as a revenue-focused application of attribution, not a completely separate discipline.
Marketing attribution can assign credit for leads, signups, opportunities, purchases, or revenue. Revenue attribution specifically evaluates the interactions that contributed to a revenue event.
This is especially important in B2B marketing attribution, where the journey may span several people, channels, and months before a deal becomes Closed Won. A single source field rarely explains that full path.
How revenue attribution works
Revenue attribution only becomes useful when the customer journey and the commercial outcome can be connected. The model comes after that connection, not before it.
Campaign → touchpoints → identity → conversion → CRM/payment → revenue → attribution model → credited revenue

1. Capture the source
Preserve campaign context with UTMs, click IDs, referrers, ad-platform metadata, and consistent source naming. Source attribution is the foundation for knowing where the journey started before more complex credit rules are applied.
2. Track meaningful behavior
Track the actions that show progression toward value: pricing views, content engagement, demo requests, signups, activation, purchases, upgrades, and revenue events. Usermaven’s event tracking can connect these actions with the acquisition context that preceded them.
3. Resolve identity
Anonymous activity becomes more useful after a reliable identifier connects it with a known lead, customer, or account. The Contacts Hub provides a person-and-company layer for joining pre-identification behavior with known profiles.
4. Connect the commercial outcome
Bring in the system that records the business result: a CRM opportunity, ecommerce order, subscription, invoice, or billing event. This is the point where the journey stops being only a marketing conversion path and becomes a revenue measurement problem.
5. Apply the attribution model
Define which touchpoints are eligible and how much credit each should receive. The same journey can produce very different channel totals under first-touch, last-touch, linear, time-decay, or a custom model.
6. Report attributed revenue
Analyze credited revenue beside spend and downstream quality metrics such as CAC, opportunity rate, win rate, ROAS, sales-cycle length, retention, or LTV. Revenue credit in isolation can hide whether a channel is efficient or whether it creates valuable customers.
What should count as revenue?
Before choosing an attribution model, define the revenue event itself. Two teams can use the same journey data and still report different attributed revenue if one uses opportunity value while the other uses Closed Won revenue.
| Business model | Revenue outcome to attribute |
|---|---|
| B2B SaaS | Closed Won ARR, ACV, booked revenue, or another agreed contract value |
| PLG SaaS | Paid subscription, MRR, upgrade, or expansion revenue |
| Ecommerce | Purchase revenue or net order revenue |
| Subscription ecommerce | Initial purchase plus repeat or renewal revenue |
| Services | Won deal value, paid invoice, or collected revenue |
| Marketplace | Transaction value, take rate, or commission revenue |
Pipeline is useful, but it is not revenue. A $100,000 opportunity can contribute $100,000 of influenced pipeline while still producing $0 in Closed Won revenue if the deal is lost.
Revenue analytics answers a broader question: how revenue is performing over time through metrics such as MRR, ARR, churn, retention, expansion, and customer value. Revenue attribution asks which recorded interactions receive credit for creating that revenue.
The revenue basis should also match the decision. A demand-generation team may use Closed Won ACV to compare acquisition programs, while finance may care about recognized or collected revenue.
For ecommerce, gross order value can overstate performance when refunds, discounts, taxes, or failed payments are material.
Document the chosen definition beside the report. Make it clear whether a channel is being judged on pipeline, bookings, subscription value, cash collected, or another outcome.
This prevents teams from comparing numbers that look similar but represent different stages of the business.
Revenue attribution vs marketing attribution
Marketing attribution is the broader practice of assigning credit to marketing interactions for a defined outcome. That outcome could be a lead, signup, opportunity, purchase, or revenue event.
Revenue attribution narrows the outcome to money. The key distinction is therefore not the channel or model,it is the business result being credited. In simple terms: all revenue attribution is attribution, but not all attribution is revenue attribution.
The distinction matters operationally. A campaign can be excellent at lead creation and poor at revenue creation if its leads rarely become opportunities, buy low-value plans, or churn quickly.
Moving the attributed outcome deeper into the funnel changes which channels look efficient and which budget decisions become defensible.
Revenue attribution vs pipeline attribution
B2B teams often need both because revenue arrives later than pipeline. Pipeline attribution provides an earlier signal; revenue attribution provides a stronger commercial outcome once the deal is actually won.
Pipeline attribution assigns credit to opportunity value or influenced pipeline. Revenue attribution assigns credit to realized commercial outcomes such as Closed Won value.
A campaign can therefore look excellent for pipeline creation but weak for final revenue if its opportunities have low win rates.
That does not make pipeline attribution inferior. It is often the earliest useful B2B signal because Closed Won revenue may arrive months later.
The important rule is to label the stage honestly: influenced pipeline is evidence of opportunity creation, while revenue attribution is evidence tied to the agreed won-revenue event.
HubSpot illustrates this distinction by separating contact-create, deal-create, and revenue attribution reports. The progression mirrors a funnel moving from lead creation to deals and then to revenue. HubSpot attribution report documentation explains the current report types and requirements.
For Salesforce-centered teams, the same logic can be applied through CRM opportunities, pipeline stages, and Closed Won values. The Salesforce marketing attribution guide goes deeper into Campaign Influence, opportunity relationships, and CRM revenue reporting.
Revenue attribution models
The best model depends on the question. Changing the model redistributes credited revenue across eligible interactions; it does not change the company’s actual total revenue.
Classic single- and multi-touch models remain useful analytical frameworks even when individual platforms support only a subset.
Google Analytics currently supports data-driven attribution and last-click options in its attribution reports rather than the older first-click, linear, time-decay, and position-based models. See Google’s current attribution guidance.
First-touch attribution

First-touch attribution gives 100% of revenue credit to the earliest eligible interaction. It is most useful when the question is: “What originally created demand?”
Last-touch attribution

Last-touch attribution gives 100% to the final eligible interaction before the revenue event. It is most useful when the question is: “What happened immediately before conversion?”
Linear attribution

Linear attribution splits credit evenly across all eligible touchpoints. It is most useful when the question is: “Which interactions participated across the full journey?”
Time-decay attribution

Time-decay attribution gives progressively more credit to interactions closer to conversion. It is most useful when the question is: “Which later interactions carried more influence?”
U-shaped attribution
U-shaped attribution emphasizes first touch and lead creation, then shares the remainder across middle touches. It is most useful when the question is: “What created demand and what turned the visitor into a known lead?”
Data-driven attribution
Data-driven attribution uses observed path data and algorithms to estimate contribution instead of applying fixed weights. It is most useful when the question is: “Which touchpoints appear to contribute most based on the available data?”
Custom attribution
Custom attribution uses business-defined rules or weights aligned with the company’s own sales process. It is most useful when the question is: “How should our business define influence?”
Linear, time-decay, U-shaped, and other models that share credit across several interactions are forms of multi-touch attribution. The broader marketing attribution models guide compares when each framework is useful and where its assumptions can distort interpretation.
| Model | Credit logic | Useful revenue question |
|---|---|---|
| First touch | 100% to earliest eligible touch | What created initial demand? |
| Last touch | 100% to final eligible touch | What preceded the revenue event? |
| Linear | Equal across eligible touches | Which interactions contributed across the journey? |
| Time decay | More credit to recent touches | Which late-stage interactions mattered most? |
| U-shaped | More credit to discovery + lead creation | What created awareness and the known lead? |
| Data driven | Algorithmic credit based on observed data | Which touches appear to contribute most? |
| Custom | Business-defined weights | How should our funnel define influence? |
How to calculate attributed revenue
The basic calculation is simple once the revenue amount and attribution share are defined.
Attributed revenue = Revenue × attribution credit percentage
Suppose a customer generates $20,000 in Closed Won revenue and has four eligible interactions. Under a linear model, each interaction receives 25% of the credit: $20,000 × 25% = $5,000 attributed revenue per interaction.
Under first-touch attribution, the earliest interaction would receive the full $20,000. Under last-touch, the final interaction would receive it. A custom model might allocate 40% to discovery, 20% to two middle touches, and 20% to the closing touch.
The model changes the distribution of the $20,000; it should not create more than $20,000 of real company revenue.
When channel reports sum to more than actual revenue, the team is usually comparing incompatible attribution systems or duplicated conversion claims.
What revenue attribution can measure
Attributed dollars are most useful when combined with funnel and efficiency metrics instead of being treated as a standalone score.
Acquisition efficiency
Compare attributed revenue with media and acquisition cost through CAC, cost per opportunity, ROAS, revenue per lead, and revenue per visitor.
A channel can generate high revenue and still be inefficient if acquisition cost is even higher.
Efficiency should also be compared on a consistent time horizon. A channel with expensive acquisition can still be attractive when it produces larger contracts, faster payback, stronger retention, or more expansion than a cheaper source.
Funnel quality
Lead-to-opportunity rate, opportunity-to-win rate, pipeline velocity, and sales-cycle length reveal whether a source creates commercially useful demand. For B2B teams, these metrics often explain why high lead volume fails to become high revenue.
For PLG or self-serve motions, the progression may be visit → signup → activation → paid → retained customer.
Revenue attribution becomes more actionable when the channel is evaluated against stages that predict long-term value rather than the easiest conversion to collect.
Revenue quality
Closed Won value, MRR or ARR, expansion revenue, LTV, repeat revenue, and retention show whether a channel creates durable customers rather than only first purchases.
The marketing attribution metrics guide provides a broader measurement framework.
This is where revenue attribution becomes more useful than a simple conversion-value report. Two channels can generate the same first-year revenue yet create very different customer quality once renewals, expansions, refunds, or repeat purchases are included.
Revenue attribution examples
The mechanics are easier to understand when the revenue event is tied to a real business model. The same attribution logic can produce very different decisions in B2B, SaaS, and ecommerce.
B2B SaaS
Journey: LinkedIn ad → webinar → organic return → demo → Salesforce opportunity → Closed Won $50,000.
First-touch attribution gives LinkedIn the $50,000 credit. A multi-touch model can share credit across LinkedIn, the webinar, organic search, and the demo interaction.
Pipeline reporting can show the $50,000 before the deal closes; revenue attribution should wait for the agreed won-revenue event.
The most useful comparison is not only which model gives LinkedIn more credit. Check whether LinkedIn opportunities reach later stages, close at a healthy rate, and generate enough contract value to justify acquisition cost.
That keeps attribution connected to sales quality instead of channel politics.
PLG SaaS
Journey: Google Ads → signup → activation → key feature adoption → paid upgrade worth $2,400 ARR.
Here, acquisition alone is not enough. Product analytics helps show whether paid signups activate, adopt important features, and become paying customers. Revenue attribution can then compare channels by subscription value rather than signup count.
If one campaign produces 200 signups but only 10 activated paying users, while another produces 80 signups and 25 retained customers, signup attribution can favor the wrong source.
Connecting product milestones to paid revenue changes the budget signal.
Ecommerce
Journey: Meta ad → organic return → email → $180 purchase.
Last-touch might credit email with all $180, while a multi-touch model can recognize discovery and return visits.
If the business has repeat purchases, separate the initial $180 from later LTV or repeat revenue so acquisition and retention are not mixed together.
The revenue value should also reflect the ecommerce decision being made. Gross order value can be useful for media reporting.
Refund-adjusted or contribution-margin views may be better for profitability decisions when returns, discounts, shipping, or variable costs differ materially by campaign.
How to set up revenue attribution
Implementation should start with the commercial outcome and work backward. Adding more models before the data chain is reliable usually creates more disagreement, not better measurement.

A practical implementation does not require every system to become one database. It requires stable identifiers, consistent definitions, and one agreed revenue record.
The attribution layer can then join marketing activity to the outcome without changing what the CRM, billing, or commerce system owns.
1. Define the revenue event
Choose the revenue basis the business will reconcile against: Closed Won value, purchase revenue, paid subscription, ARR, collected invoice, or another agreed outcome.
2. Standardize campaign data
Use consistent UTMs, click IDs, campaign names, and source definitions so the same channel is not fragmented across reports.
3. Track conversion events
Capture demos, signups, purchases, upgrades, and other milestones with stable event definitions. Avoid using a low-value proxy when leadership will ultimately judge revenue.
4. Preserve identity
Connect anonymous activity with known customers only when a reliable identifier becomes available. Maintain customer or account IDs across web, product, CRM, and billing systems where possible.
5. Connect CRM or payment data
Bring the system of commercial record into the measurement chain. Salesforce can provide opportunities and Closed Won outcomes, while HubSpot can provide contacts, deals, lifecycle stages, and revenue context.
The HubSpot revenue attribution guide covers CRM-specific reporting. Why HubSpot users need Usermaven explains how behavioral and attribution context can sit around those CRM records.
6. Choose an attribution window
Define how long an interaction remains eligible for credit. Long enterprise cycles usually need a different lookback from short ecommerce purchases. The attribution window should match the normal time to conversion and be documented alongside the model.
Case study: In ContentStudio’s Usermaven case study, the team found that a meaningful share of paid conversions happened 7–14 days after the initial ad click.
That visibility helped the team avoid cutting campaigns before delayed conversions appeared. The same case study reports 128% growth in signups, 92% more plan upgrades, and 242% more demo bookings.
7. Choose the model
Select the model based on the question: demand creation, closing interaction, full-journey participation, late-stage influence, or a business-specific rule.
8. Reconcile against revenue truth
Compare attributed totals with the CRM, billing, ecommerce, or finance record that represents the actual commercial outcome. A single source of truth prevents each platform from becoming its own competing version of revenue.
How to improve revenue attribution accuracy
Most revenue-attribution problems are data problems before they are model problems. Fix the measurement foundation before interpreting small differences between models.
Clean campaign data
Standardize UTMs, source names, campaign IDs, and channel rules. Small naming differences can split one campaign into several rows and distort credited revenue.
Validate conversions
Make sure the revenue conversion fires once, uses the right value, and represents the intended business milestone. Duplicate or proxy events can overstate results.
Preserve identity
Check anonymous-to-known matching, customer IDs, account IDs, and CRM contact relationships so journeys are not broken into several people.
Connect revenue
Use actual opportunity, order, subscription, or invoice values rather than assuming every lead has equal commercial value.
Check CRM relationships
Validate contacts, companies or accounts, opportunities, stages, and Closed Won states. B2B attribution becomes unreliable when the people involved in the deal are missing from the CRM relationship chain.
Align revenue definitions
Marketing, sales, finance, and RevOps should agree on whether the report uses pipeline, booked revenue, ARR, recognized revenue, collected revenue, or another basis.
Monitor measurement health
Tracking can degrade after site releases, campaign changes, CRM remapping, or integration issues. Usermaven’s Measurement Trust Center evaluates Collection, Identity, Integrations, Delivery, and Reliability so teams can identify measurement problems before attributed revenue is used for decisions.
Audit regularly
Run controlled customer journeys and reconcile acquisition, identity, conversion, and revenue against the source systems. A structured attribution checklist helps teams find gaps before arguing about model choice.
Revenue attribution vs incrementality
Revenue attribution asks which observed interactions should receive credit. Incrementality asks whether the revenue would have happened without the marketing activity.
For example, branded search may receive last-touch credit for a customer who was already planning to buy. The attribution model can accurately describe the observed path while still overstating the causal lift of the final click.
Use attribution to understand journeys, channel participation, and credit distribution. Use experiments, holdouts, lift studies, or other causal methods when the decision requires evidence that a campaign created incremental revenue.
How Usermaven connects marketing to revenue
Usermaven connects acquisition and behavioral data with known customers, CRM outcomes, and revenue so teams can evaluate channels by pipeline and commercial results instead of stopping at leads.
Campaign → visitor → events → identified customer → CRM/payment → revenue → attribution

Capture acquisition
Paid ads, organic sources, referrals, landing pages, and campaign data can be compared against downstream outcomes. Content attribution adds another layer for understanding which articles and content assets participate before revenue.
Follow the journey
Customer journeys make the sequence inspectable from first visit through return sessions, conversion, product behavior, CRM stage, and revenue.
Conversion path analysis helps compare recurring sequences across customers when an aggregate channel total does not explain why certain journeys produce more revenue.
Measure progression
Funnels can measure progression from visitor to signup, demo, activation, opportunity, purchase, or another defined milestone. That lets teams compare where revenue-generating journeys accelerate or drop off.
Connect CRM outcomes
CRM data extends the same acquisition and behavior timeline into opportunity stages, deal values, and Closed Won outcomes. Salesforce and HubSpot can remain systems of record while Usermaven adds the earlier acquisition and behavioral context around those records.
Compare attributed revenue
Teams can compare channel, campaign, source, landing page, content, pipeline, and revenue views without treating one model as unquestionable truth.
A marketing attribution dashboard is most useful when the revenue basis and model are visible beside the credited totals.
Validate the chain
Before using revenue attribution for budget decisions, validate tracking, identity, integration health, and conversion delivery. The same measurement foundation should also be checked before AI is asked to explain why revenue changed.
Analyze revenue attribution with AI
Suppose a dashboard says LinkedIn generated $300,000 in attributed revenue. The useful AI question is not simply whether LinkedIn “worked.”
Ask what journeys produced that revenue, how those customers progressed, and whether the same pattern appears across pipeline, retention, and customer value.
Investigate revenue patterns
Maven AI can help teams investigate questions such as:
- Which campaigns create the most Closed Won revenue?
- Which channels create many leads but little revenue?
- Which sources generate the highest pipeline per lead?
- Which journeys appear before opportunities over $50,000?
- Which campaigns create customers with stronger retention or expansion?
- Why did attributed revenue from a channel fall this month?
Explore through MCP
Usermaven MCP can expose authorized Usermaven analytics to compatible AI clients such as ChatGPT, Claude, Codex, and Cursor.
Revenue teams can ask questions such as “compare Closed Won revenue by acquisition source” or “find journeys before deals over $50K” without rebuilding every report manually.
Keep human judgment
AI can summarize patterns, flag anomalies, compare journeys, and accelerate investigation. It cannot decide what should count as revenue, whether the attribution window is appropriate, whether the CRM relationship is correct, or whether an observed relationship is causal.
See Usermaven in action
Book a free demo and discover how powerful analytics can grow your business.
Revenue attribution best practices
A strong revenue-attribution program is disciplined before it is sophisticated. These practices keep the system useful as channels, sales cycles, and reporting requirements change.
The goal is not to force every stakeholder to use the same model.
Make the revenue basis, eligibility rules, window, and source systems explicit enough that different views can be understood and reconciled instead of treated as competing truths.
Define revenue first: Agree on the commercial outcome before applying credit.
Keep the source of truth separate: Reconcile attributed revenue against CRM, billing, ecommerce, or finance records.
Preserve pre-conversion context: Do not let the journey begin only when a CRM record or purchase appears.
Use models for questions: First-touch can explain discovery while multi-touch models can explain participation across the journey.
Compare pipeline and revenue: Pipeline provides an earlier signal; realized revenue provides the stronger commercial result.
Monitor data quality: Precise-looking revenue numbers are not trustworthy when campaign, identity, conversion, or integration data is incomplete.
Review over time: Revisit models, windows, and conversion definitions when the sales cycle or channel mix changes.
Final verdict
Revenue attribution moves marketing measurement beyond clicks and leads by connecting customer interactions with a real commercial outcome. The first question is not which model to use,it is which revenue event the business wants to explain.
Reliable campaign data, identity, conversion events, CRM or payment records, revenue values, windows, and model rules matter more than model complexity. If those layers are disconnected, sophisticated attribution only creates more precise-looking uncertainty.
For teams that want acquisition, behavior, CRM outcomes, and revenue in one workflow, Usermaven provides a path from campaign → behavior → customer → revenue → attribution while keeping the underlying measurement visible and testable.
Ready to see Usermaven in action? Explore the platform or book a demo for a closer look.
Unlock insights that drive growth
FAQs
1. What is revenue attribution?
Revenue attribution assigns credit for revenue to the marketing, sales, and customer interactions that contributed to a commercial outcome. The revenue event can be Closed Won value, purchase revenue, subscription value, ARR, expansion, or another defined monetary result.
2. How does revenue attribution work?
Revenue attribution connects campaign and touchpoint data with identity, a conversion, and a CRM, payment, ecommerce, or billing outcome. An attribution model then distributes the recorded revenue across eligible interactions.
3. What is the difference between revenue attribution and marketing attribution?
Marketing attribution can assign credit for many outcomes, including leads, signups, opportunities, purchases, or revenue. Revenue attribution is the revenue-specific application of that broader practice.
4. Which revenue attribution model is best?
There is no universal best model. First-touch is useful for demand creation, last-touch for the closing interaction, linear for equal journey participation, time-decay for later influence, and custom or data-driven models for more specific business requirements.
5. How do you calculate attributed revenue?
Multiply the revenue amount by the attribution credit percentage. If a $20,000 Closed Won deal gives a touchpoint 25% credit, that interaction receives $5,000 in attributed revenue.
6. What is the difference between pipeline attribution and revenue attribution?
Pipeline attribution assigns credit to opportunity or influenced pipeline value before the deal is complete. Revenue attribution uses the realized revenue outcome, such as Closed Won value or a completed purchase.
Updated

Written by
Adeel Khan
Growth Marketing Expert
Adeel Khan is a full-stack SaaS marketer with 10+ years of experience in content marketing, paid advertising, analytics, and conversion rate optimization. He shares practical insights and strategies drawn from hands-on experience, helping B2B SaaS marketers improve performance and make better marketing decisions.
All articles by Adeel →