Your SaaS dashboard shows revenue is growing. But are you acquiring profitable customers? Are users getting value from your product? And which marketing channels are actually contributing to growth?
Looking at revenue alone won’t answer those questions.
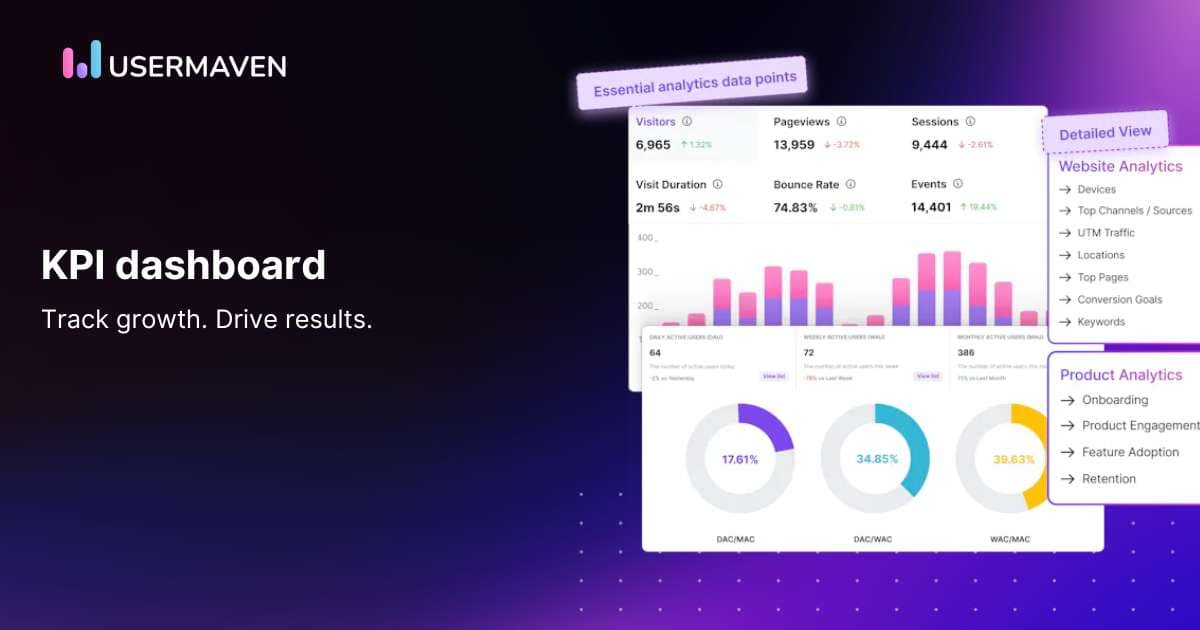
A well-designed SaaS KPI dashboard brings your most important metrics together, helping you track customer acquisition, product engagement, retention, and revenue without switching between multiple reports.
But a useful dashboard isn’t about displaying every available number. It’s about choosing the right KPIs, understanding what they tell you, and knowing when to take action.
In this guide, we’ll explore the essential metrics every SaaS company should consider, how to organize them, and what makes a dashboard genuinely useful for better business decisions.
See Usermaven in action
Book a free demo and discover how powerful analytics can grow your business.
Key takeaways
- A SaaS KPI dashboard brings your most important business metrics into one place. It helps teams monitor customer acquisition, revenue, product engagement, and retention.
- The best dashboards focus on actionable metrics. Choose KPIs that reflect your business goals instead of filling dashboards with numbers that don’t influence decisions.
- SaaS companies need both financial and behavioral metrics. MRR, ARR, CAC, churn, activation, feature adoption, and retention help reveal different aspects of business performance.
- Different teams need different dashboard views. Marketing teams may prioritize acquisition costs and pipeline, while product teams focus on activation, engagement, and retention.
- Connecting marketing, product, and revenue data gives you better context. It helps teams investigate which channels bring valuable customers and how customer behavior contributes to growth.
How to build a meaningful KPI dashboard
A good SaaS KPI dashboard should help you answer three questions: How is the business performing? What’s changing? And what needs attention?
The challenge isn’t finding metrics to track. It’s choosing the ones that actually matter.
Here’s how to build a dashboard that helps your team make better decisions.
1. Start with your business goals
Before adding charts, decide what you want to improve.
For example:
- Increase revenue: Track monthly recurring revenue (MRR), annual recurring revenue (ARR), and revenue growth.
- Improve acquisition efficiency: Monitor customer acquisition cost (CAC), lead-to-customer conversion rates, and marketing-sourced pipeline.
- Reduce churn: Track customer churn, revenue churn, and retention rates.
- Improve product adoption: Measure activation rates, feature usage, and onboarding completion.
Every KPI should connect to a business goal. If a metric doesn’t help you evaluate performance or make a decision, it probably doesn’t need a prominent place on your dashboard.
2. Choose KPIs that provide useful context
Looking at a single metric rarely tells the complete story.
For example, your customer count might be increasing, but if acquisition costs are rising faster than revenue, that growth may not be sustainable.
Similarly, higher product usage doesn’t necessarily mean customers are receiving more value.
Combine related metrics to understand performance more clearly:
| Business question | KPIs to track together |
|---|---|
| Are we acquiring customers efficiently? | CAC, conversion rate, customer lifetime value |
| Is recurring revenue growing sustainably? | MRR, new MRR, expansion MRR, churned MRR |
| Are new users finding value? | Activation rate, onboarding completion, time to value |
| Are customers staying? | Customer retention, revenue retention, churn |
| Which marketing channels contribute to growth? | Channel conversions, attributed pipeline, attributed revenue |
This makes it easier to identify meaningful changes rather than reacting to isolated numbers.
3. Create dashboards for different teams
Not everyone needs to monitor the same KPIs.
A marketing team might need a dashboard showing campaign performance, acquisition costs, and pipeline contribution.
A product team may focus on activation, engagement, and feature adoption.
Customer success teams might prioritize retention, account activity, and support performance.
For example, tracking support ticket volume alongside customer satisfaction and response times can help teams evaluate service quality. Tools such as MightyCall can support customer communication workflows, while your reporting setup brings the relevant performance metrics together.
The goal is to give each team a focused view without losing sight of shared business outcomes.
4. Make trends and comparisons easy to understand
A dashboard showing 500 new signups doesn’t tell you whether performance is improving.
Was that higher or lower than last month? Which channels contributed? How many signups became active customers?
Useful dashboards provide context through:
- Time comparisons: Compare current performance with previous periods.
- Targets: Show progress toward specific business goals.
- Segments: Compare results across customer groups, acquisition channels, or plans.
- Trends: Highlight changes over time rather than relying on isolated totals.
For example, if trial signups increase while activation rates decline, your team can investigate whether acquisition quality, onboarding friction, or another factor is affecting performance.
5. Review and improve your dashboard regularly
Your KPIs should evolve as your SaaS business grows.
An early-stage company may prioritize activation and customer acquisition. A more established SaaS business might focus more heavily on net revenue retention, expansion revenue, and acquisition efficiency.
Review your dashboards regularly to identify metrics that are no longer useful, investigate unexpected changes, and make sure the information supports current business priorities.
A meaningful dashboard isn’t the one with the most charts. It’s the one that helps your team understand performance and decide what to do next.
Shifting the focus: Evolving KPI dashboards in SaaS
As SaaS companies grow and evolve, so do the ways they measure success. In the past, it was all about basic numbers like MRR, churn rate, CAC, and LTV. While these metrics gave a good snapshot of how things were going, they only told part of the story.
Business leaders today are looking for deeper insights. They want to understand why these numbers change, not just what’s happening, which means gathering data from all corners of the company.

To truly connect financial results with the actions happening inside your business, you need a dashboard that does more than display numbers. A great KPI dashboard shows you the real reasons behind your metrics. Maybe it reveals that product usage is dipping because users can’t find a key feature, or that churn is rising because customers are frustrated with slow support. By pulling all this data together, you can turn raw numbers into clear insights that drive decisions.
And here’s the thing: this data needs to be ready right when you need it. If you’re relying on marketing campaigns, customer feedback, or new features, you can’t afford to wait for a weekly update. Businesses today need a system that gives them up-to-the-minute data, allowing them to tweak strategies on the fly.
Key elements of a SaaS KPI dashboard
A SaaS KPI dashboard should give you a clear picture of how your business is performing across revenue, customer acquisition, product engagement, and retention.
The exact metrics depend on your business model and growth stage, but the following categories provide a useful starting point.
1. Revenue and financial metrics
Revenue metrics help you understand whether your SaaS business is growing sustainably.
| KPI | What it measures |
|---|---|
| Monthly recurring revenue (MRR) | Predictable recurring subscription revenue generated each month |
| Annual recurring revenue (ARR) | Annualized recurring subscription revenue, commonly calculated as MRR × 12 |
| Average revenue per account (ARPA) | Average recurring revenue generated per customer account |
| Net revenue retention (NRR) | Recurring revenue retained from existing customers, including expansion, contraction, and churn |
| Customer lifetime value (CLV) | Estimated revenue or gross profit generated by a customer over their relationship with your business |
What to look for: If MRR is increasing but NRR is declining, new customer acquisition may be masking revenue losses from existing customers.
For a clearer picture, monitor new, expansion, contraction, and churned MRR separately.
2. Customer acquisition metrics
Acquisition metrics show how efficiently your marketing and sales efforts turn prospects into customers.
Important KPIs include:
- Customer acquisition cost (CAC): The average sales and marketing cost of acquiring a new customer.
- Visitor-to-lead conversion rate: The percentage of visitors who become leads.
- Lead-to-customer conversion rate: The percentage of leads who become paying customers.
- Trial-to-paid conversion rate: The percentage of trial users who become paying customers.
- Marketing-sourced pipeline: The value of sales opportunities attributed to marketing-sourced leads, based on your reporting definitions.
- Attributed revenue: Revenue assigned to marketing channels or touchpoints according to the attribution model used.
What to look for: A channel might generate a large number of leads but contribute relatively little pipeline or revenue.
Comparing acquisition volume with customer quality and revenue helps you make more informed budget decisions.
3. Product engagement and activation metrics
Acquiring customers is only the beginning. You also need to understand whether they’re using your product and reaching meaningful outcomes.
| KPI | What it measures |
|---|---|
| Activation rate | Percentage of eligible users who complete a defined value-driving action |
| Time to value (TTV) | Time it takes users to experience a meaningful product benefit |
| Feature adoption rate | Percentage of eligible users or accounts using a specific feature |
| Daily or monthly active users | Unique users completing defined qualifying activities within a period |
| Onboarding completion rate | Percentage of users who complete the required onboarding steps |
What to look for: If signups increase but activation remains low, your onboarding experience may need attention.
For example, a project management SaaS company might define activation as creating a project and inviting a teammate, rather than simply logging in.
Your activation definition should reflect what meaningful product value looks like for your customers.
4. Customer retention and churn metrics
Retention metrics help you understand whether customers continue using and paying for your product.
Important KPIs include:
- Customer retention rate: Percentage of customers retained over a defined period.
- Customer churn rate: Percentage of customers lost during that period.
- Revenue churn: Recurring revenue lost through cancellations and downgrades.
- Gross revenue retention (GRR): Percentage of recurring revenue retained from existing customers, excluding expansion.
- Cohort retention: Percentage of customers from a particular signup or acquisition group who remain active or subscribed over time.
What to look for: A stable customer count can hide problems if high-value accounts are leaving while smaller customers are joining.
Tracking customer retention alongside revenue retention helps you understand the financial impact of churn.
5. Customer success and support metrics
Customer support performance can provide additional context about satisfaction, friction, and retention.
Useful KPIs include:
- Customer satisfaction score (CSAT): Measures satisfaction with a specific interaction or experience.
- First response time: Time taken to provide an initial response to a customer inquiry.
- Average resolution time: Average time required to resolve support issues.
- Support ticket volume: Number of support requests received during a period.
- Net Promoter Score (NPS): Measures customers’ stated likelihood of recommending your product.
What to look for: Rising support requests alongside declining activation could indicate onboarding difficulties or product usability issues.
These patterns deserve investigation, although they don’t establish a direct cause on their own.
6. Marketing attribution and pipeline metrics
For B2B SaaS businesses, understanding where customers come from is just as important as tracking what they do after signup.
Marketing attribution metrics help connect acquisition activity with sales and revenue outcomes.
Consider tracking:
- Pipeline generated by channel: Opportunity value attributed to different acquisition sources.
- Customer acquisition by channel: Paying customers associated with each marketing source.
- Return on ad spend (ROAS): Revenue attributed to advertising relative to ad spend, using a clearly defined measurement approach.
- Sales cycle length: Time between a defined starting point, such as lead creation, and a closed deal.
- Marketing touchpoints per conversion: Number of recorded interactions associated with a conversion.
- Time to conversion: Time between a defined initial interaction and a conversion event.
What to look for: Paid search may generate faster conversions, while organic content contributes earlier interactions in longer buying journeys.
Comparing attribution models can help you understand how different channels contribute across those journeys.
Which SaaS KPIs should you prioritize?
You don’t need to display every metric on a single dashboard.
A practical approach is to select a small group of primary KPIs for each business goal and use supporting metrics when deeper investigation is needed.
| Business priority | Primary KPIs |
|---|---|
| Acquire more customers | CAC, lead-to-customer conversion rate, marketing-sourced pipeline |
| Improve product adoption | Activation rate, time to value, feature adoption |
| Increase recurring revenue | MRR, ARR, NRR |
| Reduce customer losses | Customer churn, GRR, cohort retention |
| Improve marketing efficiency | CAC by channel, attributed revenue, ROAS |
Start with the metrics your team can act on, then expand your dashboard as your reporting needs become more complex.
The future of SaaS KPI dashboards
SaaS KPI dashboards are evolving from static reporting tools into more interactive analytics platforms.
Instead of simply checking whether revenue increased or churn declined, teams can explore performance changes, investigate customer behavior, and connect data from different parts of the business.
Here are three developments shaping how SaaS companies use dashboards.
1. AI-assisted analytics makes data easier to explore
Traditional dashboards require users to know which reports to open and which metrics to compare.
AI-assisted analytics can make that process easier by allowing teams to ask questions in natural language.
For example:
- Which acquisition channels contributed the most revenue last month?
- Where are users dropping off during onboarding?
- How has feature adoption changed over the past 90 days?
- Which customer segments have experienced declining engagement?
Depending on the platform, AI can help summarize results, generate visualizations, and highlight patterns worth investigating.
However, AI-generated explanations still depend on the quality of the underlying data. A detected pattern doesn’t necessarily establish what caused it.
2. Predictive analytics helps teams prepare for possible outcomes
Predictive analytics uses historical data and statistical or machine learning models to estimate what might happen next.
For SaaS businesses, potential applications include:
- Estimating customer churn risk.
- Forecasting recurring revenue.
- Identifying accounts with expansion potential.
- Predicting demand for particular features or services.
For example, a SaaS company might use a predictive model to identify accounts showing patterns associated with previous cancellations.
The customer success team can then investigate those accounts and decide whether intervention is appropriate.
Predictive analytics requires suitable models, sufficient data, and ongoing validation. These capabilities shouldn’t be assumed to exist in every KPI dashboard.
3. Connected data provides a clearer view of business performance
Marketing, sales, product, and customer success teams often use separate reporting systems.
That makes it difficult to understand how acquisition activity connects with customer behavior and revenue.
Modern analytics platforms increasingly support integrations that help teams analyze these relationships.

For example, a SaaS company can examine:
- Which marketing channels attract customers.
- How those customers interact with the product.
- Whether they complete important activation steps.
- Which acquisition sources contribute to pipeline and revenue.
Connecting these metrics helps teams evaluate growth beyond isolated traffic, signup, or engagement numbers.
The most useful SaaS dashboards will continue to be those that make important data accessible, provide meaningful context, and help teams make informed decisions.
Final thoughts
A useful SaaS KPI dashboard isn’t about tracking every available metric. It’s about understanding how your business is performing and knowing where to focus your efforts.
Start with the KPIs that matter most to your goals, whether that’s reducing customer acquisition costs, improving activation, increasing recurring revenue, or retaining more customers.
But don’t stop at isolated metrics. Connecting marketing performance with customer behavior and revenue gives you a clearer picture of what’s driving growth.
Usermaven is an AI-powered marketing attribution platform that connects marketing channels, customer journeys, product behavior, conversions, pipeline, and revenue.
With customizable analytics dashboards, teams can monitor important KPIs, investigate performance changes, and understand which marketing efforts contribute to business results.
Book a demo to explore how Usermaven can support your SaaS reporting and attribution needs.
See Usermaven in action
Book a free demo and discover how powerful analytics can grow your business.
FAQs
1. How do I determine which KPIs to include in my dashboard?
To determine which KPIs to include, focus on metrics that directly impact your business goals, such as customer acquisition costs, lifetime value, churn rate, and revenue growth. Align your KPIs with both short-term performance and long-term strategic objectives.
2. How do KPI dashboards help in improving customer experience?
KPI dashboards can track customer-related metrics like satisfaction scores, response times, and support ticket resolution times. By analyzing these data points, businesses can quickly identify and address issues, improving overall customer experience.
3. Can KPI dashboards be customized for different business needs?
Yes, KPI dashboards can be customized to track specific metrics based on a company’s unique needs. Whether focusing on customer acquisition costs, churn rates, or operational efficiency, dashboards can be tailored to align with business goals.
4. How can Usermaven improve my SaaS KPI dashboard?
Usermaven combines website analytics, product analytics, funnels, customer journeys, and marketing attribution in customizable dashboards. SaaS teams can monitor acquisition, engagement, conversions, pipeline, and revenue-related performance while investigating which marketing channels contribute to business outcomes. Maven AI also helps teams explore their analytics data through natural-language questions.

Written by
Lauren Brooks
Lifecycle Marketing Strategist
Lauren Brooks is a lifecycle marketing strategist with 4+ years of experience helping SaaS businesses create meaningful customer experiences. She specializes in user engagement, retention, and conversion optimization, helping brands build stronger customer relationships beyond acquisition.
All articles by Lauren →