iROAS, or incremental return on ad spend, estimates how much additional revenue advertising creates for each dollar of relevant spend. It uses a causal revenue estimate rather than the conversion value assigned by an attribution model.
An ecommerce campaign can show 4.50x attributed ROAS while a controlled study estimates 2.33x iROAS. Both figures can be valid because they answer different questions. The key is whether the additional revenue covers the cost of generating it.

This guide explains the formula, the correct cost denominator, a complete worked example, break-even profitability, average vs. marginal returns, and a practical checklist for making budget decisions.
Key takeaways
Core formula: Divide estimated incremental revenue by the advertising cost appropriate to the study.
Different answers: ROAS uses model-attributed revenue; iROAS estimates revenue caused by the advertising intervention.
Evidence matters: A holdout or defensible causal analysis is required to estimate true lift.
Margin matters: An iROAS greater than 1x does not necessarily mean a campaign is profitable.
Spend must match: Use the denominator specified by the experimental design, not an unrelated budget figure.
Next-dollar decision: Average iROAS describes the tested spend; marginal iROAS examines an additional spending change.
What is iROAS in marketing?
Incremental return on ad spend (iROAS) measures additional conversion value estimated to result from a defined advertising intervention, relative to the spending associated with that intervention. The incremental portion is the outcome above a credible no-intervention baseline.
If a controlled study estimates $20,000 of additional purchase revenue from $10,000 in relevant ad spend, iROAS is 2.0x. That means an estimated $2 in additional revenue per advertising dollar, not $2 in profit.
| Quick question | Practical answer |
|---|---|
| What does iROAS stand for? | Incremental return on ad spend |
| Core formula | Incremental conversion value ÷ relevant advertising spend |
| How is it measured? | Valid experiments or suitable causal methods |
| How is it different from ROAS? | Causal lift vs. attributed conversion credit |
| Can iROAS be negative? | Yes, if the estimated revenue effect is negative |
| What makes an iROAS good? | Its return and uncertainty relative to the business break-even level |
Important: iROAS is a revenue-efficiency ratio. It does not subtract the costs of goods, fulfillment, servicing customers, or other expenses that affect profit.
Unlock insights that drive growth
iROAS vs. ROAS
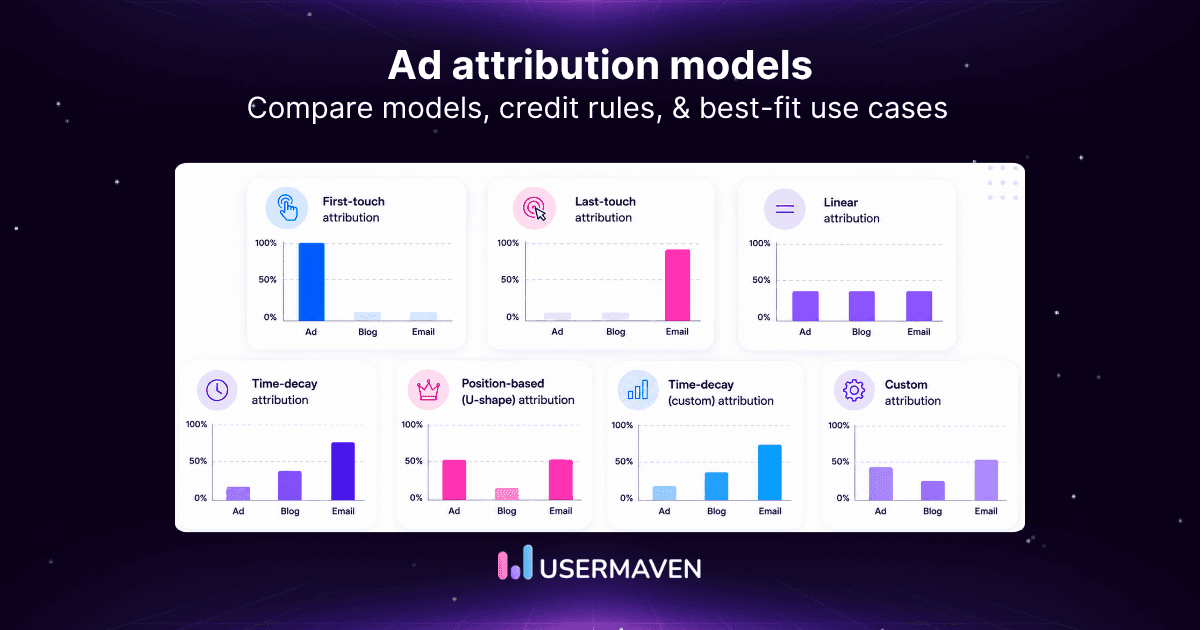
Traditional ROAS and incremental ROAS use different revenue numerators. Attribution assigns credit to recorded ad interactions; a valid incrementality study estimates the outcome difference created by an intervention.
| Dimension | Attributed ROAS | iROAS |
|---|---|---|
| Main question | What revenue received ad credit? | What extra revenue did ads cause? |
| Numerator | Model-attributed revenue | Estimated incremental revenue |
| Method | Recorded touchpoints and credit rules | Credible counterfactual comparison |
| Best use | Ongoing campaign visibility | Causal budget evaluation |
| Reporting | Typically ongoing | Study or model dependent |
| Main limitation | Does not prove causality | Requires evidence and uncertainty checks |
| Does it equal profit? | No | No |
Why the numbers can disagree
Retargeting may receive credit for an order a customer would have placed without seeing the ad. Attribution can accurately apply its own rules while the campaign causes fewer additional sales.
The methods can also differ because of audience eligibility, conversion windows, excluded offline orders, or experimental uncertainty. In some circumstances, iROAS may even exceed attributed ROAS; neither direction is a universal law.
Attribution and incrementality answer different questions, as the comparison of incrementality vs. attribution makes clear. Performance marketing attribution still helps teams monitor campaigns and customer journeys between causal experiments.
How to calculate iROAS
The formula is iROAS = incremental conversion value ÷ relevant advertising spend. Use the same revenue definition, comparable groups, and an ad-spend denominator appropriate to the tested intervention.
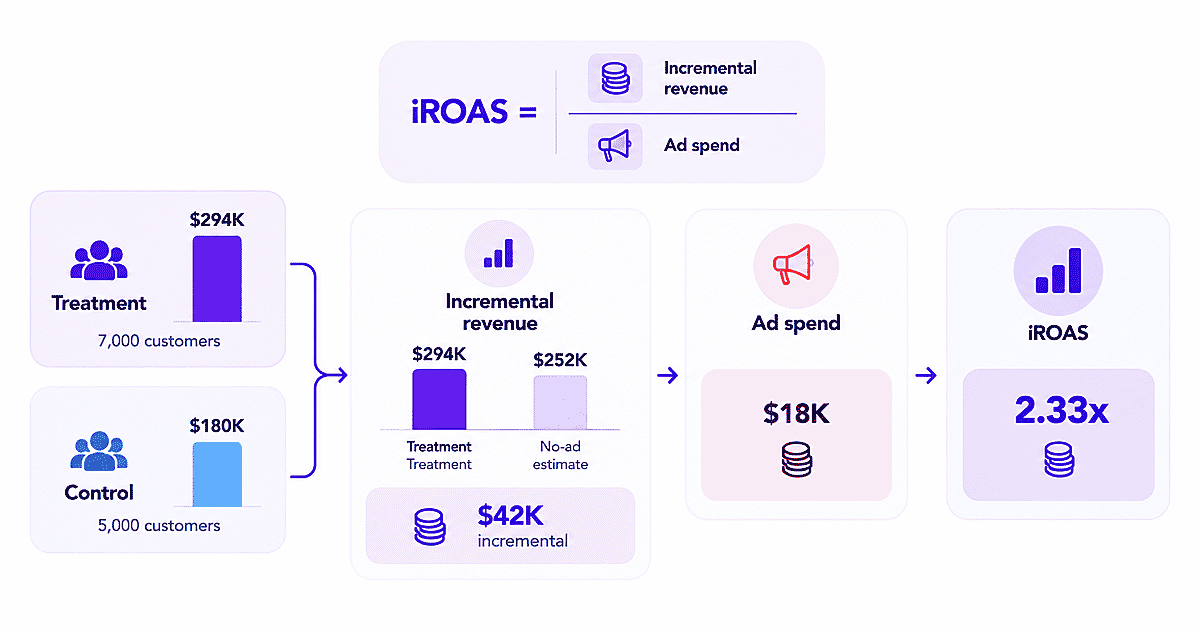
The following hypothetical campaign uses randomized treatment and control populations. Their sizes differ, so revenue per eligible customer is used before estimating the counterfactual.
| Experiment measure | Treatment | Control |
|---|---|---|
| Eligible customers | 7,000 | 5,000 |
| Purchase revenue | $294,000 | $180,000 |
| Revenue per eligible customer | $42 | $36 |
| Additional campaign input | Value |
|---|---|
| Ad spend being evaluated | $18,000 |
| Revenue credited by attribution | $81,000 |
| Contribution margin before advertising | 35% |
Assumptions: The $18,000 is the incremental cost of the intervention being evaluated. Assignment is valid, outcomes and timing are comparable, and revenue is measured consistently. All figures are illustrative.
Step 1. Estimate no-advertising revenue
The control group generated $180,000 ÷ 5,000 = $36 per eligible customer. Applying that rate to 7,000 treatment customers gives an estimated control-condition revenue of $252,000.
Step 2. Calculate the incremental revenue
Treatment revenue was $294,000. Subtracting the normalized no-advertising estimate of $252,000 produces $42,000 estimated incremental revenue for the treated population.
This is a point estimate with sampling and possible design uncertainty; it does not identify which individual purchases were caused by ads.
Step 3. Calculate incremental ROAS
Divide $42,000 by the relevant $18,000 cost. iROAS = 2.33x. The tested intervention generated an estimated $2.33 in extra purchase revenue for each advertising dollar.
Step 4. Calculate attributed ROAS
The attribution model credited $81,000 to the campaign. Attributed ROAS = $81,000 ÷ $18,000 = 4.50x. Assigned credit is higher than the estimated causal lift.
| Metric | Result |
|---|---|
| Model-attributed revenue | $81,000 |
| Estimated incremental revenue | $42,000 |
| Relevant ad spend | $18,000 |
| Attributed ROAS | 4.50x |
| iROAS | 2.33x |
A credible baseline is essential when calculating incremental revenue. The same distinction matters in incremental revenue attribution, where revenue receiving marketing credit must be distinguished from the additional revenue marketing caused.
Which advertising spend belongs in iROAS?
The denominator must represent the spending relevant to the same causal effect. Different studies do not always define that spending identically.
| Study design | Denominator to use | Meaning |
|---|---|---|
| User-based ad holdout | Total spend on the tested ads, as specified by the study | Revenue lift per tested ad dollar |
| Geo spend-change test | Incremental cost between conditions | Lift per extra ad dollar |
| Budget-increase experiment | Additional spend due to the increase | Return on the next spend increment |
| Multi-channel intervention | Relevant intervention cost defined in the protocol | Return across the tested activity |
The cost definition must reflect the intervention being evaluated. For example, Meta’s GeoLift methodology uses geographic comparisons and synthetic controls to estimate causal impact when user-level randomization is impractical. The numerator and spending denominator must describe the same intervention.
Avoid dividing incremental revenue for one campaign by spending across an entire channel. Conversely, do not divide a full campaign lift estimate by only one small ad set’s cost.
Reporting periods also matter because spending and conversions may happen on different dates. Usermaven’s paid ads attribution documentation explains conversion-date and spend-date reporting, which can help reconcile recorded outcomes with campaign costs without establishing the experiment’s causal effect.
See what's working. Fix what's not. Grow faster.
How to measure incremental ROAS reliably
A credible iROAS figure needs two measurement layers: an estimate of the revenue effect, and reliable records of spending and realized outcomes. Neither substitutes for the other.
1. Define the advertising decision
State exactly what the result should influence. Examples include switching off retargeting, raising prospecting spend, or testing whether branded search creates sales that would otherwise be organic.
Record the eligible customers or regions, tested campaigns, dates, expected conversion lag, and planned interpretation before the experiment begins.
2. Select a defensible causal design
Audience holdouts can isolate controlled exposures. Geographic tests can evaluate regional spending changes when user-level exclusion is infeasible. Other causal models require stronger assumptions and sensitivity checks.
Experiment quality matters as much as the formula. Measured’s 2026 incremental lift analysis explains how holdouts, matched markets, and uncertainty affect the estimate. The broader principles of incrementality in marketing also apply when selecting a defensible test.
3. Choose a revenue outcome, not a vanity metric
For ecommerce, use consistently defined purchase value, ideally accounting for relevant refunds. For SaaS, distinguish booked pipeline, closed-won deals, subscription MRR, and collected or recognized revenue.
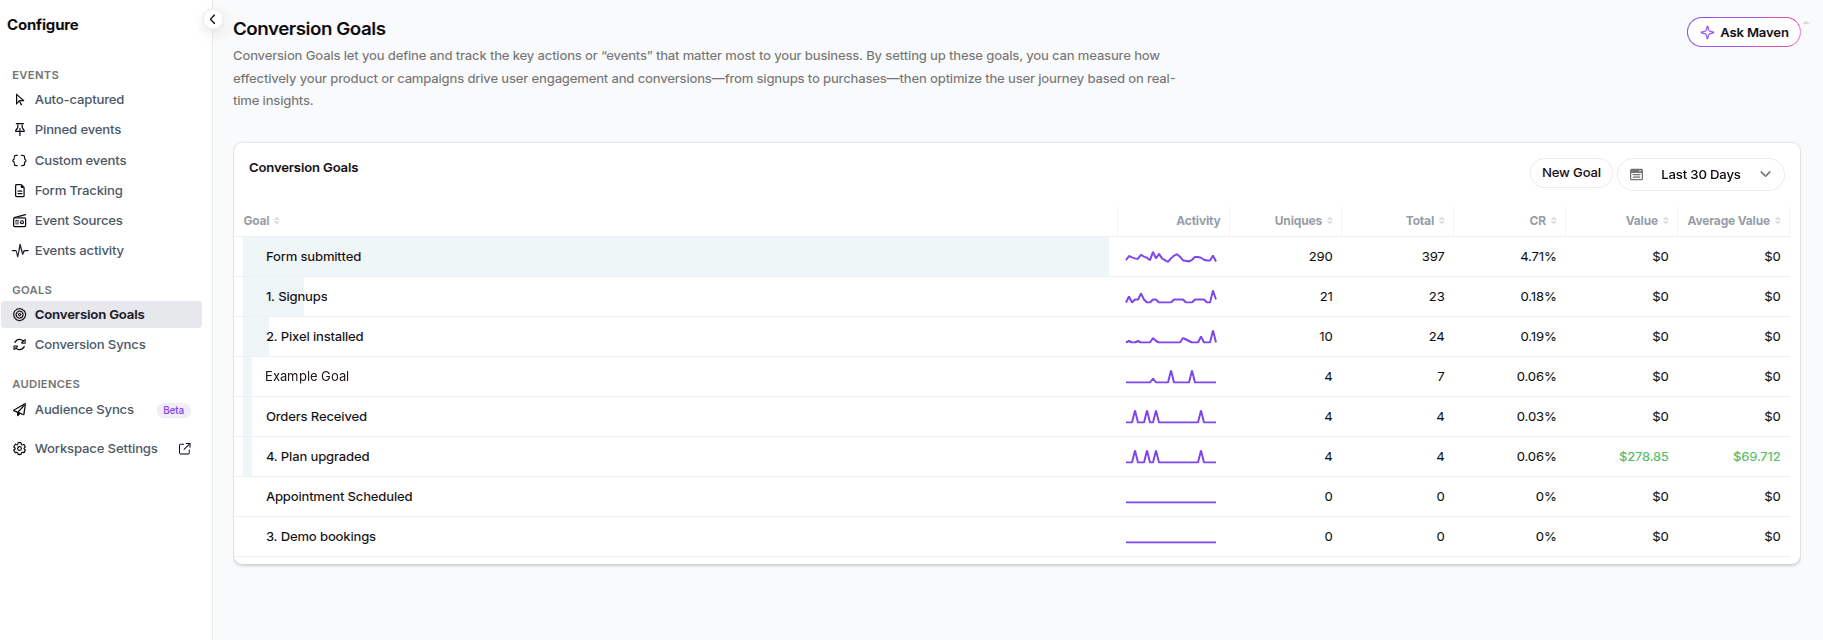
When transaction values vary, Usermaven’s conversion goals can record supported dynamic monetary values from custom events. These records supply an outcome for analysis, but do not by themselves establish that advertising caused it.
4. Connect advertising spend and real transactions
Ad-network spend, campaign IDs, conversion dates, order or deal IDs, value, and currency must be compatible. A clicked checkout button is not evidence that payment was completed.
For a more complete revenue record, teams can use event tracking setup to collect on-site actions and Event Sources to import supported payments, subscription changes, and refunds that occur elsewhere.
Those inputs help teams reconcile an experiment’s revenue outcomes with finance records. They do not perform the holdout experiment automatically.
5. Audit collection and causal assumptions
Check missing conversions, duplicate orders, refund handling, mismatched time zones, campaign exclusions, control-group contamination, and sample-ratio or pre-period anomalies.
Before acting on revenue results, teams can examine tracking, matching, and integration issues in the Measurement Trust Center. These checks strengthen data reliability, although they cannot certify experimental randomization or causal identification.
6. Report the estimate and its uncertainty
Publish the incremental revenue estimate, denominator, point iROAS, uncertainty interval when available, and business threshold. A positive point estimate may still be inconclusive if plausible values include financially poor outcomes.
| Required field | What to document |
|---|---|
| Intervention | Campaign, audience, geography, and change tested |
| Counterfactual | Control group or model and its key assumptions |
| Revenue | Metric, source, refunds, currency, and lag |
| Cost denominator | Exactly which ad spend is included and why |
| Quality checks | Missing events, duplication, contamination, coverage |
| Result | Incremental value, iROAS, uncertainty, date range |
| Decision | Break-even threshold and next budget action |
A result that cannot be reconstructed from its assumptions and sources is not ready to guide a major budget decision.
What is a good iROAS?
There is no universal good iROAS. The economic threshold depends on how much additional revenue remains after costs other than the advertising spend being evaluated.
Calculate the break-even return
When contribution margin is expressed before the advertising cost being evaluated, the simple threshold is break-even iROAS = 1 ÷ contribution margin. This assumes the margin captures other relevant incremental costs.
| Contribution margin before ads | Break-even iROAS |
|---|---|
| 20% | 5.00x |
| 25% | 4.00x |
| 35% | 2.86x |
| 40% | 2.50x |
| 50% | 2.00x |
| 60% | 1.67x |
| 75% | 1.33x |
Apply the threshold to the campaign
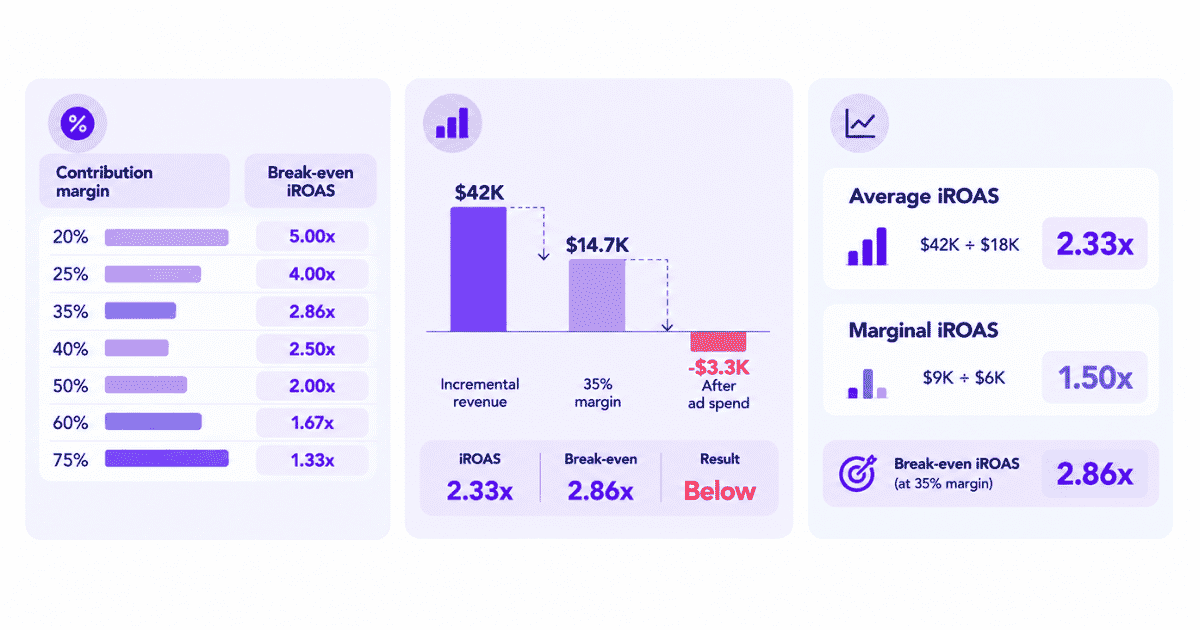
Our worked example produced $42,000 estimated incremental revenue at a 35% contribution margin. This leaves $14,700 contribution before advertising.
Subtracting the $18,000 intervention cost gives −$3,300 estimated incremental contribution after advertising. The 2.33x iROAS falls below the 2.86x break-even threshold.
| Economic measure | Illustrative result |
|---|---|
| Attributed ROAS | 4.50x |
| iROAS | 2.33x |
| Break-even iROAS | 2.86x |
| Contribution before media | $14,700 |
| Contribution after media | −$3,300 |
An iROAS above 1x means estimated additional revenue exceeds the relevant ad cost, not that all costs are covered. If customer lifetime value is considered, assumptions about retention, margin, timing, and uncertainty must be explicit.
For sales-led businesses, Usermaven’s B2B SaaS solution connects recorded acquisition activity with CRM outcomes. Forecast opportunity values and estimated lifetime value should still be distinguished from experimentally observed revenue.
Average vs. marginal iROAS
Average iROAS describes a tested advertising intervention. Marginal iROAS answers a narrower question: what additional revenue results from the next increase in spending?
| Metric | Illustrative calculation | Decision answered |
|---|---|---|
| Average iROAS | $42,000 ÷ $18,000 = 2.33x | How efficient was the tested intervention? |
| Marginal iROAS | $9,000 ÷ $6,000 = 1.50x | How efficient was the extra $6,000? |
| Break-even iROAS | 1 ÷ 35% = 2.86x | What return covers the relevant costs? |
Suppose a separately identified $6,000 budget increase causes $9,000 in extra revenue. Its marginal iROAS is 1.50x, below the same 2.86x break-even return.
That outcome would not support scaling under these assumptions, even if an earlier campaign period showed stronger average performance. Competition, audience saturation, and creative fatigue can reduce the return on the next dollar.
Marginal iROAS also requires causal evidence. Dividing two arbitrary month-over-month changes is not enough to estimate a causal spending response.
Common iROAS calculation mistakes
Most errors come from comparing numbers that answer different questions. The following checks prevent a polished dashboard from producing an unsupported budget recommendation.
| Mistake | Why it is misleading | Better practice |
|---|---|---|
| Use attributed revenue as the numerator | Credit is not causal lift | Use an estimated counterfactual |
| Subtract control revenue twice | Double-counts the baseline | Calculate lift only once |
| Choose unrelated ad spend | Changes the ratio meaning | Match the experiment cost |
| Assume iROAS > 1x means profit | Ignores contribution margin | Calculate the break-even return |
| Ignore refunds or delayed conversions | Misstates revenue | Reconcile finance and event records |
| Compare unlike populations | Study and dashboard differ in scope | Align eligibility and outcomes |
| Ignore uncertainty | Point estimate can be imprecise | Report intervals and limitations |
| Treat attribution weights as lift tests | Model weights only change credit | Require causal evidence |
Usermaven offers configurable attribution, including Enterprise custom attribution models confirmed in its September product announcements. Changing model weights alters credit allocation; it does not turn attributed ROAS into experimental iROAS.
How to use iROAS for budget decisions
The correct response to an iROAS result depends on evidence quality, economic threshold, and whether the tested conditions resemble the proposed budget decision.
| Finding | Meaning | Decision to consider |
|---|---|---|
| iROAS above break-even with reliable evidence | Intervention appears economically worthwhile | Test controlled scaling |
| iROAS below break-even with reliable evidence | Incremental contribution may not cover spend | Reduce or redesign investment |
| Positive iROAS with broad uncertainty | Profitability is unclear | Collect more evidence |
| Marginal iROAS below break-even | Next dollar is unlikely to cover costs | Do not assume scaling helps |
| Incomplete or invalid study | No defensible causal result | Repair measurement or experiment |
| Negative estimated lift | Revenue may decrease under treatment | Investigate intervention and assumptions |
Use attribution between experiments
Causal tests cannot replace day-to-day visibility into spend, customer journeys, credited conversions, and lead quality. Those operational views help identify campaigns that deserve closer testing.
Between experiments, Usermaven’s paid ads attribution solution connects campaign spending with credited conversions and revenue. This helps monitor operational performance, while the causal estimate must come from a suitable external experiment or analysis.
Recheck when conditions change
A result from one audience, channel, spend level, and conversion window is not universal. New markets, budget changes, competition, or creative changes may alter the return.
A broader marketing measurement approach combines ongoing attribution reporting with carefully interpreted causal evidence. Retest when audience, campaign, or budget conditions materially change rather than applying one lift estimate indefinitely.
Final verdict
iROAS measures additional advertising-generated revenue relative to relevant spending. It provides stronger causal evidence for spending decisions than attributed ROAS when the counterfactual is credible and the experiment is valid.
But iROAS is not profit. Before increasing budgets, check the denominator, the uncertainty around incremental revenue, contribution margin, and the return on the next spending increment.
Reliable ad-budget decisions also depend on consistent spending, conversion, and revenue data. To explore how Usermaven connects these recorded measurements, book a demo.
FAQs
1. What does iROAS mean in marketing?
iROAS means incremental return on ad spend. It compares estimated additional revenue caused by an advertising intervention with the spending relevant to that experiment, rather than using attribution credit as the numerator.
2. How do you calculate incremental ROAS?
Estimate revenue under treatment and a credible no-advertising condition, then divide the resulting incremental value by the cost specified for the study. For example, $20,000 incremental revenue on $10,000 spend is 2.0x.
3. What is the difference between iROAS and ROAS?
Traditional ROAS divides attributed conversion value by advertising spend. iROAS divides estimated causal revenue lift by relevant spend. Both need compatible scopes and periods before their reported values can be compared.
4. What is considered a good iROAS?
A good iROAS exceeds the applicable economic break-even threshold with sufficiently reliable evidence. At a 40% contribution margin before media, a simplified break-even iROAS is 2.5x, assuming no other relevant unaccounted costs.
5. Can iROAS be negative?
Yes. If a credible experiment estimates that an intervention reduced revenue, incremental conversion value is negative and iROAS can also be negative. The result still needs uncertainty and design checks before a budget decision.

Written by
Junaid Ahmed
Content Writer & Digital Marketer
Junaid Ahmed is a content and copywriter with 3+ years of experience creating research-driven content across SaaS, B2B, ecommerce, and digital marketing. He specializes in turning complex topics into clear, practical content that helps marketers better understand their challenges, evaluate solutions, and make informed decisions. His work spans educational content, industry insights, and actionable marketing guides.
All articles by Junaid →