A $10,000 deal closes, and three different reports claim three different channels deserve the credit. That’s the daily reality for marketing teams comparing attribution numbers after every closed-won deal.
The problem gets worse as customer journeys stretch across five, ten, or more touchpoints before a prospect ever signs a contract. Picking the wrong revenue attribution model doesn’t just create confusing dashboards; it can steer budget toward channels that look better under one attribution rule while undervaluing others that contributed earlier in the journey.
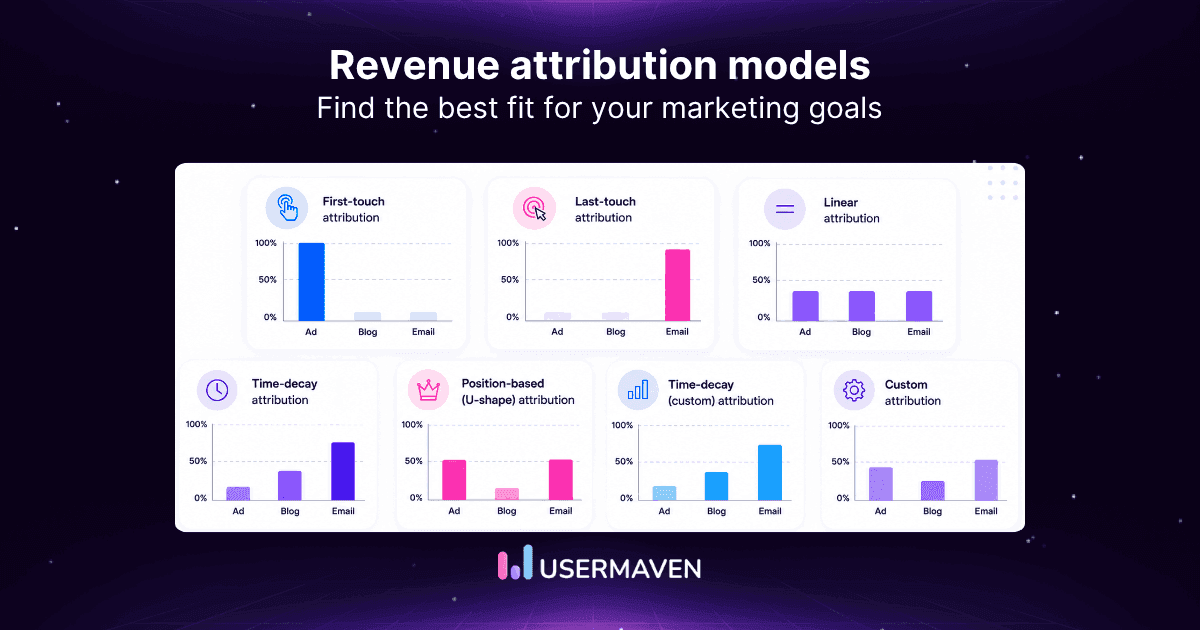
Revenue attribution models are the rules or algorithms used to decide how much credit each marketing touchpoint receives for revenue. This guide compares the major models side by side using one consistent $10,000 deal, so you can see exactly how first-touch, last-touch, linear, time-decay, U-shaped, and data-driven attribution can interpret the same customer journey differently.
Key takeaways
No single revenue attribution model is universally correct; different models answer different measurement questions.
Single-touch models, such as first-touch and last-touch, assign all revenue credit to one interaction and therefore leave the rest of the journey out of the calculation.
Multi-touch attribution models distribute revenue credit across several interactions using different rules.
The actual revenue doesn’t change when you switch models. What changes is how that revenue is attributed across channels and touchpoints.
Data-driven attribution can provide a more customized view, but it requires sufficient high-quality data and shouldn’t automatically be treated as causal truth.
Instead of asking which attribution model is universally best, start with the business question you’re trying to answer.
What is a revenue attribution model?
A revenue attribution model is a rule or methodology used to assign revenue credit to the marketing and sales touchpoints that occur along a customer’s path to conversion.
Instead of stopping at clicks, leads, or form submissions, revenue attribution connects customer interactions with outcomes such as purchases, pipeline, and closed-won revenue.
For example, suppose a customer discovers your company through organic search, later clicks a LinkedIn ad, opens an email, returns to your website, and finally converts after clicking a Google ad.
Which interaction deserves credit for the resulting revenue?
That’s what the attribution model determines.
Different models can produce very different answers even when they’re analyzing exactly the same customer journey.
Single-touch vs. multi-touch attribution: The key structural difference
Single-touch attribution gives 100% of the revenue credit to one interaction in the customer journey.
First-touch attribution, for example, credits the first recorded interaction, while last-touch attribution credits the final interaction before conversion.
Multi-touch attribution distributes revenue credit across multiple interactions.
Instead of assuming that one touchpoint created the entire outcome, models such as linear, time-decay, and U-shaped attribution divide credit according to predefined rules.
Single-touch models are useful when you want a simple answer to a specific question, such as which channels introduce customers or which interactions occur immediately before conversion.
Multi-touch marketing attribution models provide more context when journeys involve multiple channels, sessions, and interactions, which is common in B2B SaaS.
The worked example: one $10,000 deal, five touchpoints
Here’s one user journey we’ll use throughout this guide to show how revenue attribution models can assign credit so differently to the same outcome. A prospect discovers a company through organic search, clicks a LinkedIn ad two weeks later, opens a follow-up nurture email a few days after that, explores the product directly on the website, then clicks a Google Ads retargeting ad right before signing a $10,000 contract.
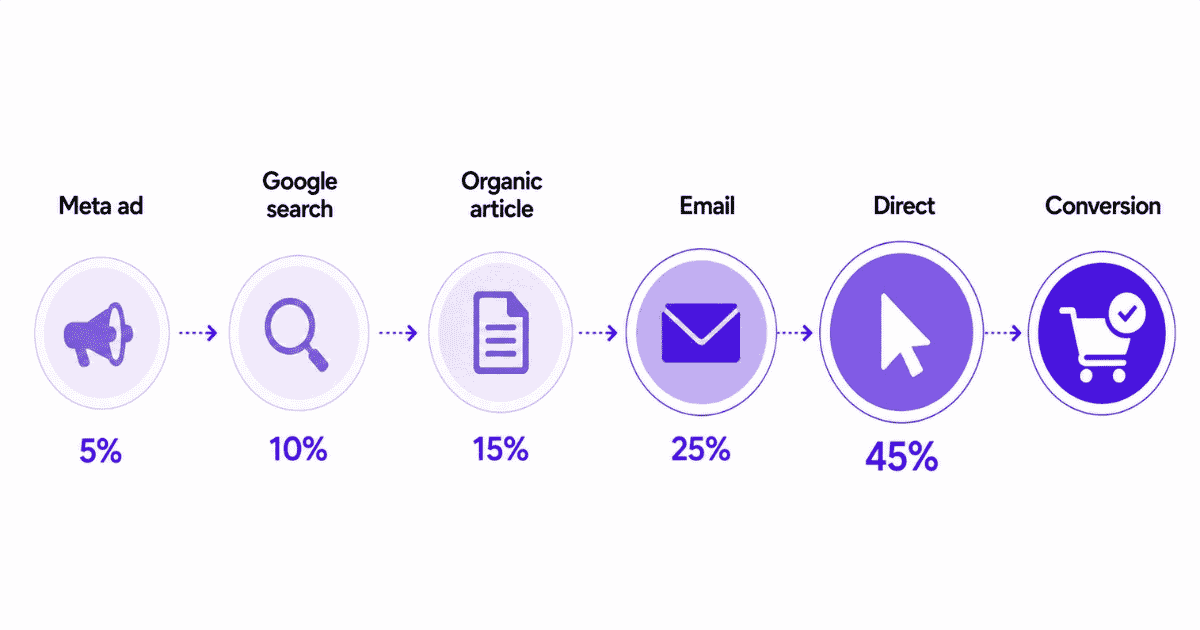
That journey breaks down into five distinct, trackable touchpoints, each representing a different stage of the buying decision.
Organic search visit: The discovery moment when the prospect first learns the company exists.
LinkedIn ad click: A paid social touchpoint that reinforces awareness.
Email click: A nurture touchpoint that keeps the prospect engaged.
Product or website interaction: A consideration signal showing real buying intent.
Google Ads click: The final paid touchpoint right before the deal closes.
The deal itself is worth $10,000, and that figure never moves no matter which attribution model gets applied to it afterward. What changes, sometimes dramatically, is how much of that $10,000 each touchpoint appears to have earned once a specific model runs the numbers. That distinction, fixed revenue against shifting reported credit, is the single most important idea running through this guide, and every model comparison below builds directly on this same five-step journey.
Core revenue attribution models explained
The most common marketing revenue attribution models use predetermined rules for assigning credit.
First-touch, last-touch, linear, time-decay, and U-shaped attribution can therefore analyze the same journey and reach very different conclusions about which channels deserve credit.
Let’s apply each model to the same $10,000 deal.
1. First-touch attribution
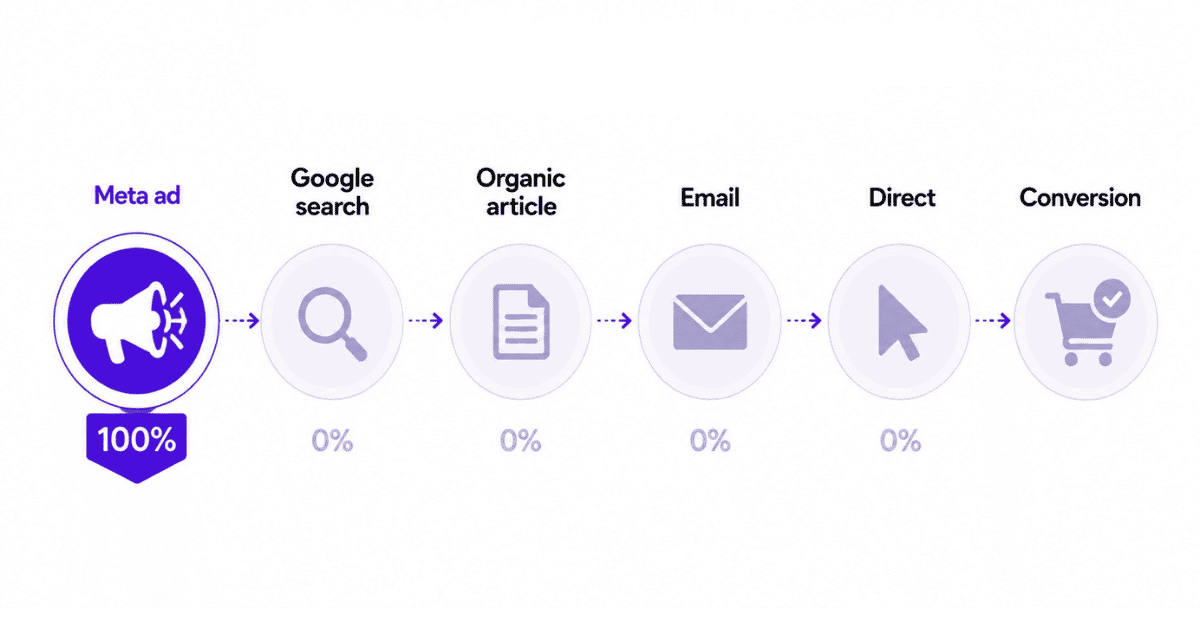
First-touch attribution assigns 100% of the revenue credit to the customer’s first recorded marketing interaction.
In our example, that interaction is organic search.
So the attribution would be:
Organic search: $10,000
LinkedIn Ads: $0
Email: $0
Product interaction: $0
Google Ads: $0
First-touch attribution is useful when you’re trying to answer:
Which channels are introducing customers who eventually generate revenue?
That makes it particularly useful for evaluating discovery and customer acquisition.
If organic search consistently appears as the first touchpoint for customers who later generate significant revenue, first-touch reporting makes that contribution visible.
The limitation is equally clear.
It ignores everything that happens afterward.
In our example, LinkedIn, email, the product interaction, and Google Ads receive no credit even though all four were part of the recorded journey.
First-touch attribution therefore shouldn’t automatically be interpreted as proof that the first channel independently caused the sale.
2. Last-touch attribution
Last-touch attribution assigns 100% of the revenue credit to the final recorded interaction before conversion.
In our example:
Google Ads: $10,000
Every previous interaction receives $0.
Last-touch attribution answers a different question:
Which touchpoint occurred immediately before customers converted?
This can make it useful for analyzing bottom-of-funnel channels and campaigns.
However, it can heavily favor channels that commonly appear near conversion, including branded search and retargeting, while giving no credit to the interactions responsible for discovery or nurturing.
Consider our example.
Organic search introduced the prospect. LinkedIn reinforced awareness. Email continued the relationship. The prospect then explored the product.
But last-touch attribution reports:
Google Ads generated $10,000.
That doesn’t mean Google Ads independently caused the entire sale. It means Google Ads was the touchpoint selected by the attribution rule.
3. First non-direct and last non-direct attribution
Direct visits can complicate attribution because they don’t always reveal the marketing source responsible for bringing someone back.
That’s where non-direct attribution models can help.
First non-direct attribution assigns credit to the first identifiable non-direct source in the journey.
Last non-direct attribution assigns credit to the last identifiable non-direct source before conversion.
Suppose our prospect visited directly immediately before converting rather than clicking the Google ad.
A pure last-touch model could assign the conversion to direct traffic.
A last non-direct model would instead look backward for the most recent identifiable marketing source.
These models can be useful when direct visits would otherwise obscure the marketing channel you’re trying to analyze.
5. Time-decay attribution
Time-decay attribution gives progressively more credit to touchpoints that occur closer to conversion.
Unlike linear attribution, the distribution depends on when each interaction occurred, not merely the order in which the interactions happened.
Suppose our five touchpoints occurred over several weeks.
Organic search happened first. LinkedIn came later. Email and the product interaction occurred closer to the sale. Google Ads was the final marketing interaction.
A time-decay model would assign progressively more weight toward the later interactions.
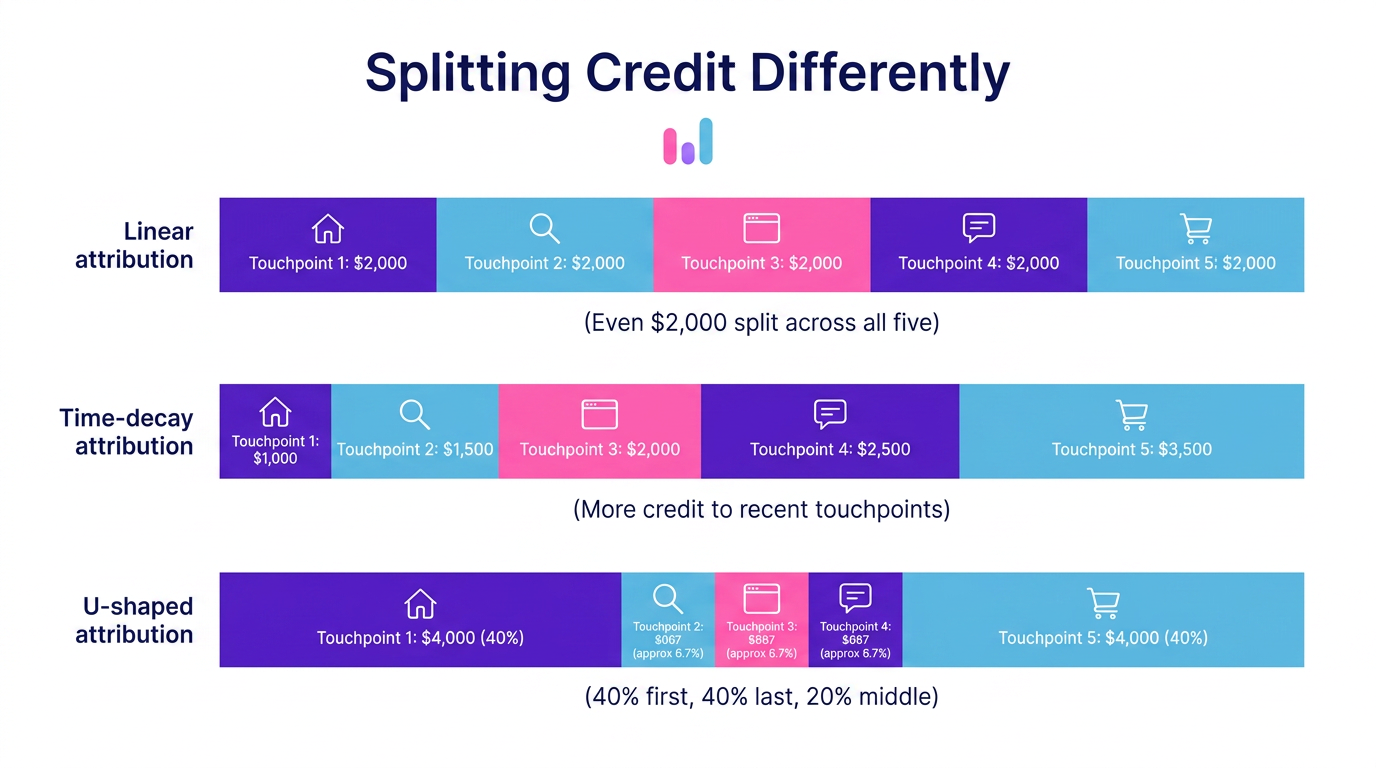
For illustration, the distribution might look something like:
Organic search: lower credit
LinkedIn Ads: more credit
Email: more credit
Product interaction: higher credit
Google Ads: highest credit
The exact dollar distribution depends on the decay formula and timestamps used by the attribution system, so there isn’t one universal percentage allocation for time-decay attribution.
The model is useful for answering:
Which interactions occurred as customers moved closer to conversion?
This can be valuable for longer journeys where nurturing and late-stage interactions matter.
However, time-decay attribution contains a built-in bias toward recency.
A channel responsible for introducing a high-value customer months earlier can receive relatively little credit simply because it happened earlier in the journey.
6. U-shaped attribution
U-shaped attribution, also called position-based attribution, gives greater weight to the first and last interactions while distributing the remaining credit across the middle of the journey.
A common implementation assigns:
40% to the first interaction
40% to the last interaction
20% across the middle interactions
For our $10,000 deal:
Organic search receives:
40% × $10,000 = $4,000
Google Ads receives:
40% × $10,000 = $4,000
The remaining:
$2,000
is divided among LinkedIn Ads, email, and the product interaction.
With three middle touchpoints, that’s approximately:
Organic search: $4,000
LinkedIn Ads: $666.67
Email: $666.67
Product interaction: $666.66
Google Ads: $4,000
U-shaped attribution answers:
Which interactions introduced the customer and which interactions occurred closest to conversion while still acknowledging the journey between them?
It’s particularly useful when both acquisition and conversion are important measurement points.
Its weakness is that the 40/20/40 allocation is still an imposed rule. It doesn’t prove that the first and last interactions genuinely caused 80% of the outcome.
7. W-shaped and full-path attribution
Some B2B attribution frameworks go further by assigning additional weight to important funnel milestones.
W-shaped attribution commonly emphasizes three milestones:
First interaction
Lead creation
Opportunity/deal creation
One common implementation gives 30% to each of those three milestones and distributes the remaining 10% among other interactions.
Full-path attribution extends this logic further by considering additional milestones across the customer lifecycle.
These approaches can make sense for B2B organizations where the journey from anonymous visitor to lead, opportunity, and customer is clearly tracked in a CRM.
However, implementations and definitions can vary between attribution platforms.
The important principle isn’t the exact percentage.
It’s that milestone-based attribution allows teams to assign more weight to interactions associated with meaningful changes in the buyer journey rather than treating every touchpoint equally.
Revenue attribution models compared: The same $10,000 deal
Here’s what happens when we apply the models with deterministic allocations to the same journey:
| Model | Organic search | LinkedIn ad | Product interaction | Google Ads | |
|---|---|---|---|---|---|
| First-touch | $10,000 | $0 | $0 | $0 | $0 |
| Last-touch | $0 | $0 | $0 | $0 | $10,000 |
| Linear | $2,000 | $2,000 | $2,000 | $2,000 | $2,000 |
| U-shaped (40/20/40) | $4,000 | $666.67 | $666.67 | $666.66 | $4,000 |
Time-decay isn’t assigned fixed dollar values in this table because its calculation requires the exact timestamps and decay formula being used.
That distinction matters.
The customer journey hasn’t changed.
The company hasn’t earned any additional revenue.
The marketing channels haven’t changed.
Yet organic search can appear responsible for anywhere from $0 to $10,000 depending on which attribution model you’re viewing.
That’s why attribution numbers should be interpreted in the context of the model producing them.
A channel receiving $0 under last-touch attribution doesn’t necessarily mean the channel had no value. It means the last-touch model doesn’t assign revenue to that position in the journey.
Data-driven and AI-powered attribution: Beyond fixed rules
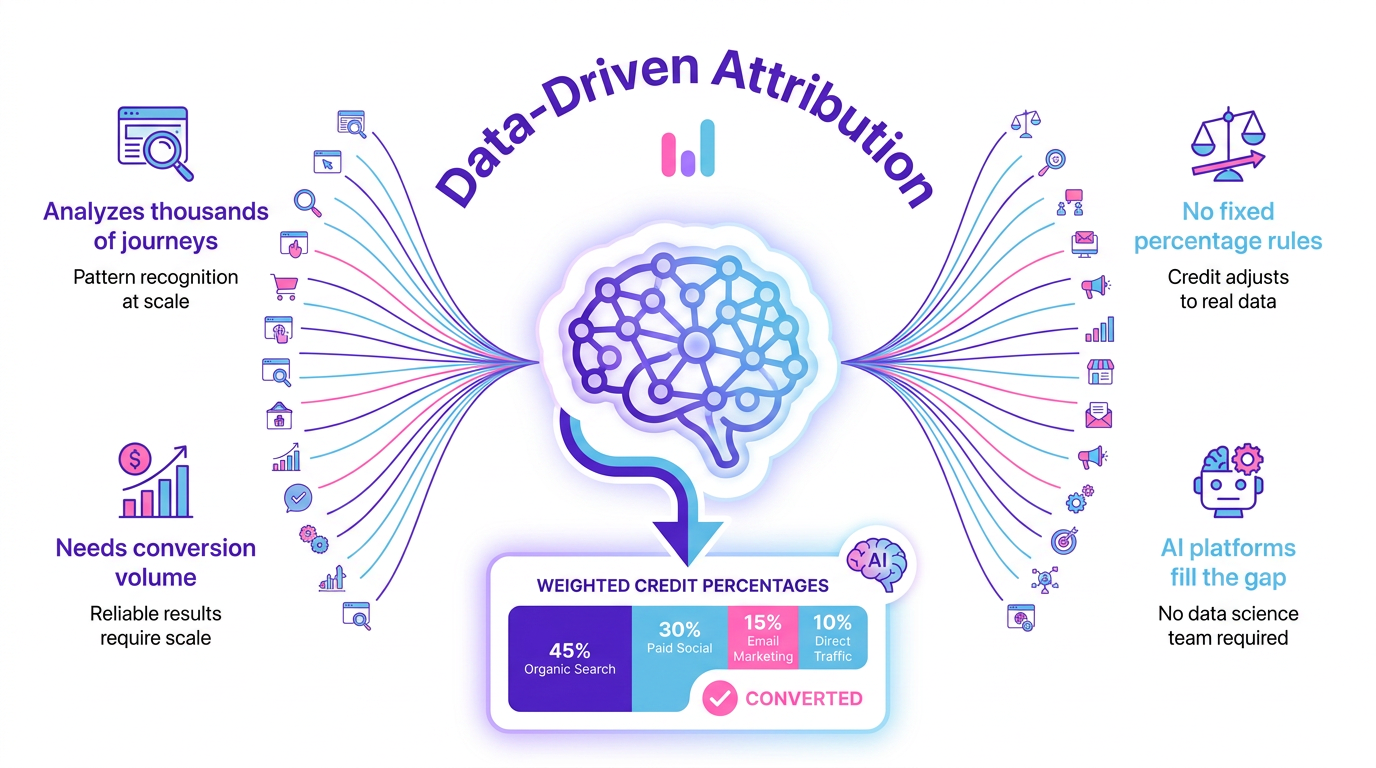
Data-driven attribution uses observed conversion and journey data to estimate how attribution credit should be distributed instead of relying entirely on predetermined percentages.
Rule-based attribution starts with an assumption.
For example:
First interaction = 40%
Last interaction = 40%
Everything between them = 20%
Data-driven approaches instead analyze patterns across many customer journeys and use statistical or machine-learning methods to estimate the contribution associated with different interactions.
That sounds inherently superior, but there’s an important caveat:
More sophisticated doesn’t automatically mean more accurate.
The quality of data-driven attribution depends on factors such as:
Conversion volume
Tracking completeness
Identity resolution
Journey coverage
Data quality
Model methodology
The amount of historical data available
A company closing only a small number of deals may not have enough data for a sophisticated model to generate stable estimates.
Data-driven attribution can also be harder for marketers and executives to interpret because the weighting isn’t as transparent as a rule like “40% to first touch and 40% to last touch.”
And attribution itself should not automatically be treated as proof of causality.
If a channel receives significant attribution credit, that tells you how the measurement system has estimated or assigned its contribution. Determining whether removing that channel would actually reduce incremental revenue is a different measurement question.
Which revenue attribution model should you use?
The best revenue attribution model depends on the question you’re trying to answer, the complexity of your customer journey, and the quality of the data available.
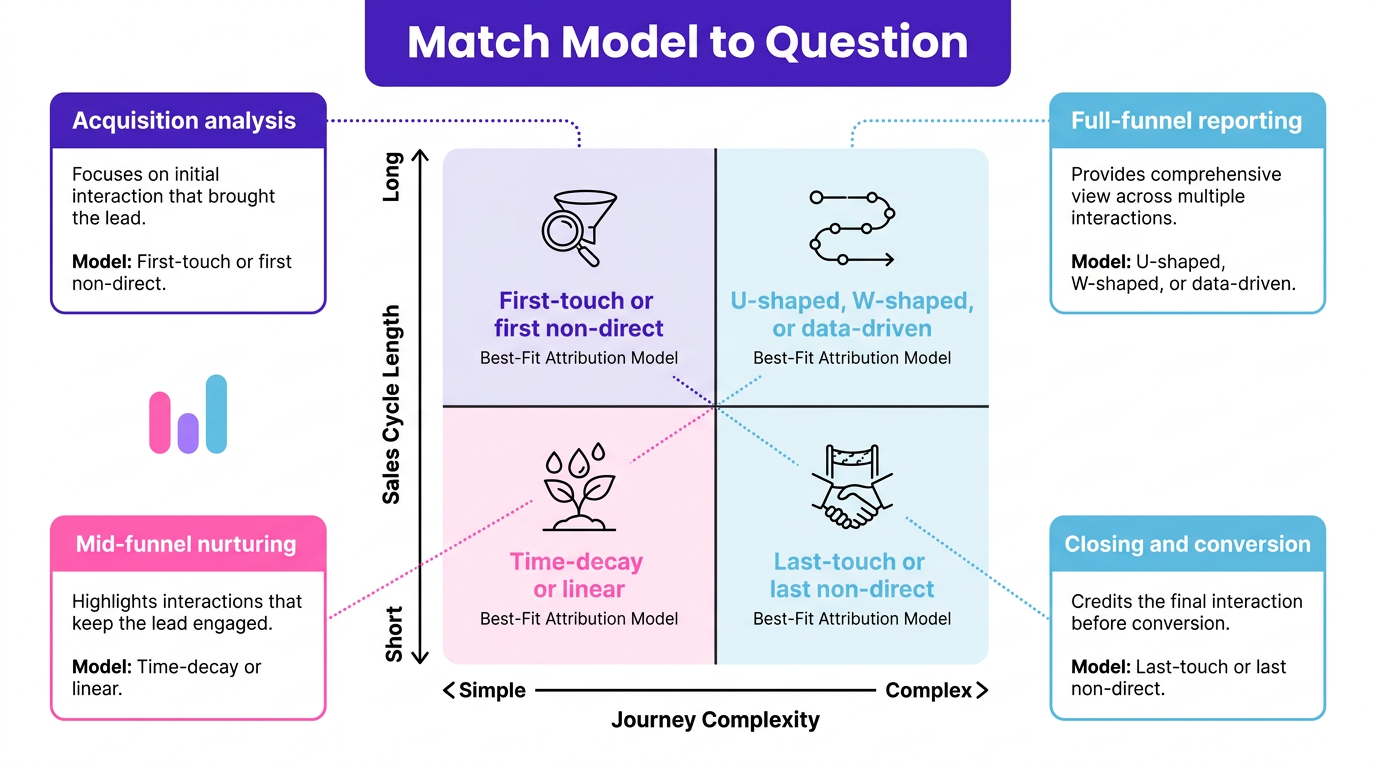
Instead of asking:
What’s the best attribution model?
Ask:
What am I trying to learn from attribution?
Here’s a practical framework.
| If you want to understand… | Start with |
|---|---|
| Which channels introduce future customers | First-touch / first non-direct |
| Which channels appear immediately before conversion | Last-touch / last non-direct |
| How revenue looks when every touch receives equal credit | Linear |
| Which interactions happen closer to conversion | Time-decay |
| Both discovery and conversion while retaining some mid-journey credit | U-shaped |
| Important B2B funnel milestones | W-shaped / milestone-based |
| Contribution based on patterns across sufficient historical data | Data-driven attribution |
Don’t necessarily choose only one model
This is one of the most important principles in revenue attribution modeling.
First-touch and last-touch aren’t necessarily competitors.
They’re answering different questions.
Imagine organic search repeatedly dominates first-touch attribution while paid search dominates last-touch.
That doesn’t automatically mean one report is wrong.
It could mean organic search frequently introduces future customers while paid search frequently appears toward the end of their journeys.
A multi-touch model can then provide another perspective on what happens between those points.
Comparing models can therefore be more informative than declaring one model the organization’s single source of truth for every marketing question.
What’s the best revenue attribution model for B2B SaaS?
There is no universally best revenue attribution model for B2B SaaS. Multi-touch models usually provide more journey context, while single-touch models remain useful for answering specific acquisition and conversion questions.
B2B SaaS attribution becomes particularly difficult because a typical customer journey may involve:
Multiple sessions
Organic search
Content
Email
Product interactions
Demo requests
Sales conversations
CRM stages
Offline interactions
Several weeks or months between first touch and revenue
That creates two problems.
First, assigning everything to one interaction can erase most of the journey.
Second, a sophisticated multi-touch model can’t fix incomplete tracking.
For example, imagine a prospect:
Reads an SEO article → sees LinkedIn Ads → downloads a guide → attends a demo → starts a trial → talks to sales → becomes a $30,000 customer
First-touch attribution can tell you what introduced that customer.
Last-touch can tell you which recorded interaction occurred immediately before the conversion event you’re measuring.
Multi-touch attribution can distribute credit across the journey.
CRM-connected attribution can help connect those marketing interactions with opportunity and closed-won revenue.
Each perspective answers a different question.
For B2B SaaS teams, the stronger approach is often to compare multiple attribution models while maintaining a sufficiently long lookback window to capture the actual sales cycle.
How to build reliable revenue attribution
Choosing a model is only one part of revenue attribution.
If the underlying journey data is incomplete, changing models simply changes how incomplete data gets distributed.
1. Define what “revenue” means
Determine which outcome you’re attributing.
That might be:
Ecommerce purchase revenue
Subscription revenue
Closed-won deal value
New MRR or ARR
Expansion revenue
Without a consistent revenue event, attribution reports become difficult to interpret.
2. Capture the customer journey
You need visibility into the interactions occurring before the revenue event.
Depending on your business, that could include:
Website visits
Organic search
Email
Forms
CRM activities
Offline conversions
3. Standardize campaign tracking
UTM parameters and consistent campaign naming help attribution systems understand where traffic originated.
Inconsistent campaign tracking can fragment what should be one channel or campaign into several different sources.
4. Connect CRM and revenue data
For B2B SaaS, the conversion often doesn’t happen on the website.
A visitor may submit a form today but become a closed-won opportunity weeks later.
Connecting marketing journey data with CRM and revenue data is what allows attribution to move beyond lead generation and toward actual pipeline and revenue attribution.
5. Capture relevant offline conversions
Phone calls, sales meetings, events, manually created opportunities, and other offline activities may be important parts of the journey.
If they’re absent from your measurement system, your attribution model can’t consider them.
6. Choose an appropriate attribution window
An attribution or lookback window determines how far backward the system considers interactions when assigning credit.
This is particularly important for B2B SaaS.
If your typical customer takes four months to convert but your attribution window only considers the previous 30 days, important early interactions can disappear from the analysis.
Your attribution window should therefore reflect the reality of your sales cycle rather than an arbitrary default.
7. Compare attribution models
Run different models against the same revenue.
Look for substantial changes.
Does organic dominate first-touch but disappear under last-touch?
Does paid search suddenly receive most revenue when you switch models?
Do certain campaigns consistently appear across multiple models?
Those differences are information, not necessarily contradictions.
8. Validate the data before reallocating budget
Don’t move budget simply because one attribution dashboard tells you a channel has low attributed revenue.
Check:
Are UTMs intact?
Are conversions being captured?
Is CRM revenue connected correctly?
Are cross-session journeys preserved?
Are offline conversions missing?
Is the lookback window long enough?
Is the selected attribution model appropriate for the question?
A sophisticated attribution model applied to unreliable data still produces unreliable conclusions.
Common revenue attribution mistakes
Here are some common mistakes teams make:
Treating one model as absolute truth
A first-touch report and a last-touch report can tell completely different stories about the same $10,000 deal.
That’s expected.
The mistake is assuming whichever model happens to be displayed represents objective causal truth.
Measuring leads instead of revenue
A campaign generating the most leads isn’t necessarily generating the most revenue.
Revenue attribution becomes substantially more useful when customer journeys are connected with downstream outcomes such as opportunities, purchases, and closed-won revenue.
Ignoring offline touchpoints
Sales calls, events, demos, and offline conversions can disappear from digital-only journeys unless they’re connected through CRM data or another tracking mechanism.
Using incomplete or inconsistent UTMs
Poor campaign tagging makes accurate source and campaign attribution harder regardless of the model.
Losing customer identity between sessions
If the same person appears as multiple unrelated visitors, their journey becomes fragmented.
The attribution model can only work with the interactions it can associate with the customer.
Using too short an attribution window
This can disproportionately affect channels that operate earlier in long customer journeys.
Double-counting revenue
Revenue should remain consistent as you switch models.
The model redistributes attribution credit; it shouldn’t create additional revenue.
Assuming sophisticated attribution is automatically better
Complex models introduce their own assumptions, data requirements, and interpretation challenges.
The most useful model is the one that reliably answers the business question you’re asking.
How Usermaven handles revenue attribution
Usermaven brings customer journeys, marketing attribution, and revenue data together so teams can analyze which channels and touchpoints receive credit for conversions and revenue.
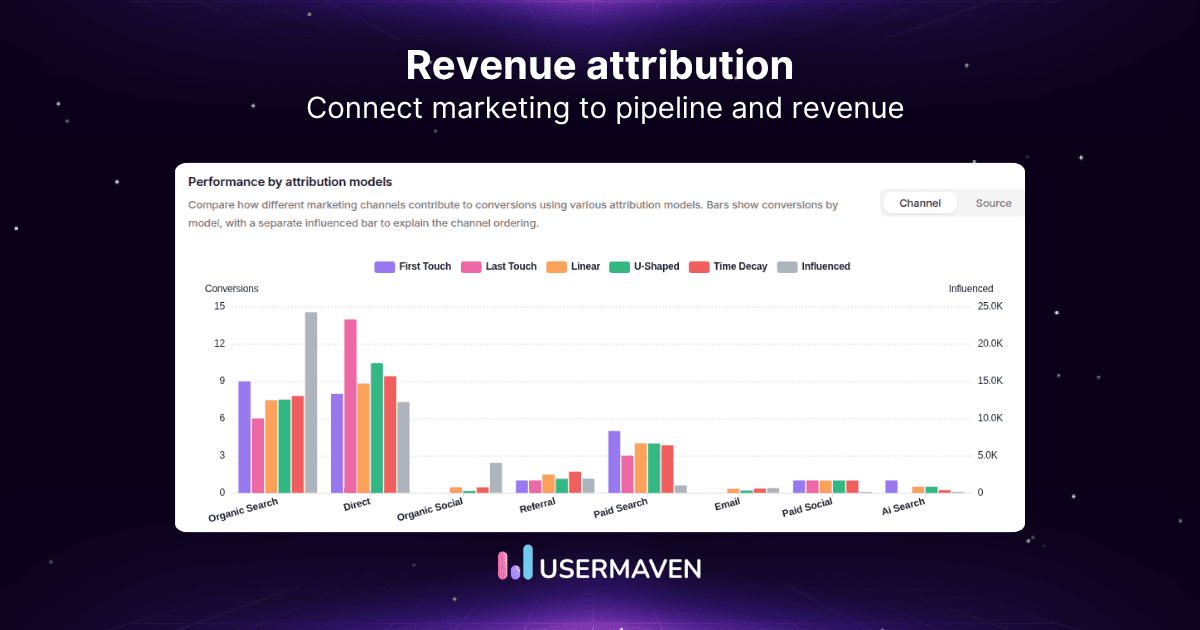
Instead of relying on one attribution perspective, teams can analyze performance using multiple models, including:
First-touch
Last-touch
Linear
U-shaped
Time-decay
First non-direct
Last non-direct
That makes it possible to ask different questions of the same customer journey.
For example, a marketing team could use first-touch attribution to understand which channels introduce customers, then compare that against last-touch and multi-touch attribution to understand how channel credit changes later in the journey.
Usermaven also connects attribution with customer journey data and marketing, CRM, and revenue sources, helping teams follow the path from acquisition through conversion, pipeline, and revenue.
For B2B SaaS businesses with longer sales cycles, Usermaven supports a 365-day lookback window, helping preserve earlier touchpoints that shorter measurement windows can miss.
The objective isn’t to find a model that magically reveals one indisputable source of revenue.
It’s to give marketing and growth teams enough context to understand how acquisition channels, campaigns, and customer interactions contribute across the journey and make better-informed budget decisions.
To sum it up
Revenue attribution models show how revenue credit changes across the customer journey depending on the attribution logic you use. The right model depends on whether you want to understand acquisition, conversion, or the full path between them.
Usermaven helps marketing teams compare attribution models, connect touchpoints to pipeline and revenue, and understand which channels are contributing to growth. As a marketing attribution platform, it gives you a clearer view of the customer journey without relying on a single attribution perspective.
Ready to see Usermaven in action? Explore the platform or book a demo for a closer look.
Frequently asked questions
What is a revenue attribution model?
A revenue attribution model is a rule or methodology that determines how revenue credit is assigned to marketing and sales interactions in a customer’s journey. Different models distribute the same revenue differently depending on which touchpoints they prioritize.
What are the different revenue attribution models?
Common revenue attribution models include first-touch, last-touch, first non-direct, last non-direct, linear, time-decay, U-shaped or position-based, W-shaped, full-path, and data-driven attribution. Some assign all credit to one interaction, while others distribute credit across multiple touchpoints.
What is the best revenue attribution model?
There is no universally best revenue attribution model. The right model depends on what you want to measure. First-touch is useful for acquisition, last-touch for final interactions, linear for equal multi-touch credit, time-decay for recency-weighted analysis, and U-shaped attribution for emphasizing both discovery and conversion.
What is multi-touch revenue attribution?
Multi-touch revenue attribution distributes revenue credit across multiple interactions in the customer journey instead of assigning 100% to a single touchpoint. Linear, time-decay, U-shaped, and W-shaped attribution are examples of multi-touch models.
Which attribution model is best for B2B SaaS?
No single model is best for every B2B SaaS company. Because B2B journeys often involve multiple channels and long sales cycles, multi-touch models can provide useful journey context. First-touch and last-touch remain valuable when teams specifically want to analyze acquisition or final conversion interactions.
How do attribution models affect marketing ROI?
Updated

Written by
Imrana Essa
SaaS Marketing Lead
Imrana Essa is a marketing lead and content strategist with 8+ years of experience creating and leading content for B2B and SaaS brands. She specializes in marketing analytics, attribution, content strategy, and organic growth, translating complex marketing concepts into clear, actionable insights. Her work focuses on helping marketers understand performance, make data-informed decisions, and build strategies that contribute to sustainable growth.
All articles by Imrana →