Paid advertising produces a lot of data. Every campaign generates impressions, clicks, costs, and dozens of other metrics.
Yet many marketing teams still struggle to answer a simple question: which ads are actually driving results?
Paid ads analytics helps marketers move beyond surface-level metrics and understand real campaign performance. By analyzing ad data alongside user behavior and conversions, teams can identify which campaigns bring valuable traffic and which ones waste budget.
What is paid ads analytics?
Paid ads analytics is the process of collecting and analyzing data from advertising campaigns to understand how well your ads are performing.
It helps marketers answer important questions such as:
- Which ads are bringing the most traffic?
- Which campaigns lead to conversions or revenue?
- Where is ad budget being wasted?
Instead of relying only on reports inside ad platforms, paid ads analytics combines advertising data with website behavior and conversion tracking. This gives marketers a clearer picture of how campaigns influence the full customer journey.
You may also hear this referred to as advertising analytics, paid media analytics, or ad performance analytics. While the terms are often used interchangeably, they all focus on the same goal: understanding how paid campaigns contribute to business results.
By analyzing this data, marketers can identify high-performing campaigns, optimize targeting, improve ad creatives, and allocate budgets more effectively across channels.
Why paid ads analytics matters for marketing ROI
Paid advertising can generate results quickly, but it can also burn through your budget just as fast. Without proper analytics, it’s difficult to know which campaigns are actually contributing to revenue.
With the right analytics in place, marketers can:
- Identify high-performing campaigns that generate conversions or revenue
- Reduce wasted ad spend by spotting underperforming ads early
- Understand which channels drive the best results across search, social, and display ads
- Improve targeting and creatives based on real engagement and conversion data
- Allocate budgets more effectively toward campaigns that deliver the highest return
Over time, these insights help marketing teams optimize campaigns continuously and improve the overall return on their advertising investments.
How to track paid ads analytics effectively
Tracking paid ads analytics requires more than checking numbers inside ad platforms. To understand how campaigns actually perform, marketers need to connect advertising data with user behavior and conversions.
A simple tracking workflow usually includes the following steps.
Start by pulling performance data from the platforms where your campaigns run. This usually includes impressions, clicks, engagement, spend, and conversions.
For most teams, that means checking reports in platforms like Google Ads, Meta Ads Manager, and LinkedIn ads analytics to see how each campaign is performing at the source.
This gives you the basic campaign data, but it is only the starting point.
Ad platform reports can tell you how many people clicked, but they cannot fully explain what users did after they landed on your site.
That is why the next step is connecting your ad platforms with website analytics such as Usermaven. This helps you understand whether ad traffic is actually leading to meaningful actions such as signups, purchases, or demo requests.
Once this connection is in place, you can track the full user journey instead of only the click.
Step 3: Set up conversion and event tracking
After connecting your data sources, define the actions you want to measure. These could include:
- Account signups
- Purchases
- Booked demos
- Form submissions
Event tracking helps you tie these actions back to specific campaigns, audiences, and ads. It also helps you separate traffic that looks good on the surface from traffic that actually converts.
Step 4: Review ad engagement in context
Not all engagement is equally valuable. A campaign may generate comments, reactions, or clicks without moving users closer to conversion.
This is why it helps to review engagement alongside conversion data. For example, if comment activity is distracting from campaign goals, teams may even look into disabling comments on Facebook ads where it makes sense for brand safety or moderation.
The goal is to focus on engagement signals that support performance, not just activity for the sake of activity.
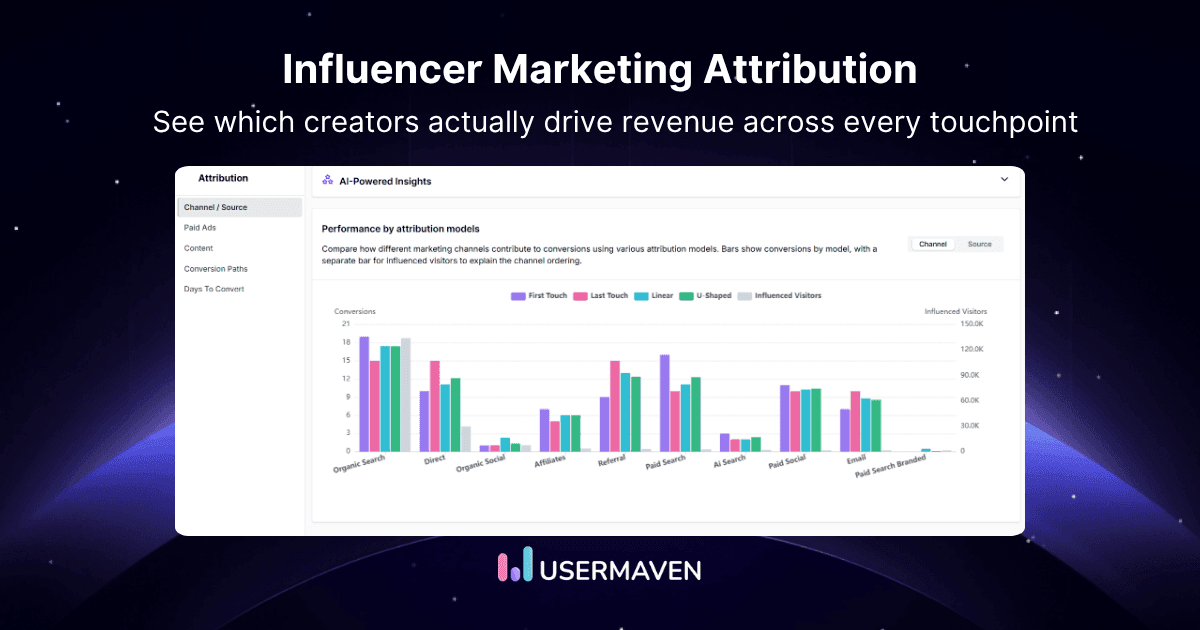
Step 5: Analyze attribution across campaigns
Most customers do not convert after seeing a single ad. They might click a search ad, come back from a retargeting campaign, and convert later through another channel.
Attribution helps you understand how those touchpoints work together. Instead of giving all the credit to the final click, you can see which campaigns assisted the conversion and influenced the customer journey.
This gives you a much clearer view of what is actually driving results.
Performance is not only shaped by targeting and budget. The quality of your ad creatives also plays a major role in how campaigns perform.
As part of your analysis, review which messages, visuals, and formats generate the strongest engagement and conversions. This is particularly important for display campaigns, where different banners, layouts, and copy variations can produce very different outcomes.
Many teams now automate parts of their creative production process to launch and test new variations faster. In these cases, integrating creative assets for display ads via APIs can help streamline workflows and keep campaigns fresh while making it easier to track how each variation performs.
If your team is experimenting with AI ads, this step becomes even more important because faster creative production also means you need a reliable way to measure which versions actually drive results.
Step 7: Optimize and repeat
Once you have reliable tracking in place, use the insights to improve performance over time.
This might mean:
- Shifting budget to stronger campaigns
- Refining audience targeting
- Testing new creatives
- Improving landing and exit pages
- Adjusting bidding strategies
Paid ads analytics is not a one-time task. The more consistently you review and act on your data, the easier it becomes to improve campaign performance and reduce wasted spend.
Key metrics used in paid ads analytics
Tracking paid ads analytics usually starts with understanding a few core performance metrics. These metrics help marketers evaluate how campaigns are performing and whether advertising spend is generating meaningful results.
Some of the most commonly used metrics include:
If you want a deeper breakdown of these metrics and how to analyze them, check out our guide on ad performance metrics, where we explain the most important metrics marketers use to measure advertising success.
Choosing the right analytics tool makes it much easier to understand how your advertising campaigns perform across channels. While ad platforms provide their own reports, dedicated analytics tools help marketers connect ad performance with user behavior, attribution insights, and revenue outcomes.
Below are some of the best paid ads analytics tools marketers use to track and optimize advertising performance.
1. Usermaven
Usermaven is a website analytics and marketing attribution platform that helps marketers understand how paid campaigns influence the entire customer journey. Instead of looking at ad platform metrics in isolation, it connects advertising data with on-site behavior, conversions, and revenue insights.
Its advanced paid ads attribution capabilities allow teams to see exactly how campaigns contribute to signups, purchases, and other key actions. By integrating advertising data with website and product analytics, marketers get a clearer picture of which channels and campaigns are actually driving growth.
Usermaven integrates directly with major advertising platforms, allowing teams to analyze ad performance alongside user behavior and conversion data in one place.
Key capabilities include:
These features help marketing teams move beyond surface-level metrics and focus on how paid campaigns contribute to real business outcomes.
2. Google Analytics 4 (GA4)
Google Analytics 4 is widely used for tracking website traffic and understanding how users interact with your site after clicking ads. It allows marketers to analyze sessions, events, conversions, and engagement metrics connected to advertising campaigns.
Key capabilities include:
- Website traffic and engagement tracking
- Campaign tracking through UTM parameters
- Integration with Google Ads
- Event-based tracking model
While GA4 is used for website behavior analysis, it focuses mainly on post-click activity and often requires additional tools for deeper advertising attribution and cross-channel analysis.
3. Triple Whale
Triple Whale is a marketing analytics platform designed primarily for ecommerce brands running paid campaigns across platforms such as Meta, Google, and TikTok.
The platform focuses on combining advertising performance with revenue attribution so marketers can see how campaigns impact sales.
Key capabilities include:
- Centralized advertising performance dashboard
- Ecommerce-focused attribution insights
- Real-time campaign monitoring
- Integration with ecommerce platforms like Shopify
It is particularly popular among ecommerce teams that need clearer visibility into how advertising drives purchases.
4. Hyros
Hyros is an attribution-focused analytics platform designed to help marketers track conversions across multiple advertising channels.
The platform emphasizes advanced tracking and attribution techniques to connect advertising interactions with customer acquisitions.
Key capabilities include:
- Multi-channel attribution tracking
- Conversion tracking across ad platforms
- Data feedback loops for campaign optimization
- Customer journey analysis
Hyros is commonly used by businesses running high-volume advertising campaigns that require deeper attribution insights.
5. Cometly
Cometly is an attribution and analytics platform designed to help teams understand the impact of their paid advertising campaigns.
It focuses on connecting advertising performance with customer journeys and revenue outcomes.
Key capabilities include:
- Real-time campaign analytics dashboards
- Multi-touch attribution models
- Conversion tracking across channels
- Integration with advertising and CRM tools
These insights help marketers evaluate which campaigns contribute most effectively to customer acquisition and revenue.
6. Supermetrics
Supermetrics is a marketing data integration tool that helps marketers pull advertising data from multiple platforms into a single reporting environment.
Instead of analyzing data separately in each ad platform, teams can consolidate campaign data into tools like Google Sheets or Looker Studio.
Key capabilities include:
- Data integration from multiple advertising platforms
- Automated marketing reporting
- Custom dashboard creation
- Integration with BI and reporting tools
Supermetrics is widely used by marketing teams and agencies that rely on custom dashboards for campaign analysis.
7. Improvado
Improvado is a marketing analytics and data integration platform designed for companies managing large advertising operations across many channels.
The platform consolidates marketing data into centralized dashboards or data warehouses for deeper analysis.
Key capabilities include:
- Integration with hundreds of marketing platforms
- Automated marketing data pipelines
- Cross-channel campaign analysis
- Custom reporting dashboards
Improvado is often used by enterprise marketing teams that require large-scale data integration.
8. Sprout Social
Sprout Social is primarily known as a social media management platform, but it also provides analytics tools for tracking paid social campaigns.
Its reporting dashboards help marketers analyze engagement, audience behavior, and campaign performance.
Key capabilities include:
- Paid social campaign reporting
- Social media engagement analytics
- Audience insights and performance tracking
- Campaign reporting dashboards
Sprout Social is particularly useful for teams that run a large portion of their advertising campaigns on social platforms.
9. Funnel.io
Funnel.io is a marketing data platform designed to collect and organize campaign data from multiple advertising platforms.
It helps marketing teams centralize advertising data and send it to reporting tools or data warehouses for deeper analysis.
Key capabilities include:
- Automated marketing data collection
- Cross-channel campaign reporting
- Integration with BI tools and dashboards
- Data transformation and organization
Funnel.io is commonly used by marketing teams and agencies that rely on centralized data reporting.
10. Adverity
Adverity is a marketing analytics platform focused on data integration, automation, and visualization for large marketing datasets.
It helps organizations bring together advertising data from multiple sources and analyze performance in centralized dashboards.
Key capabilities include:
- Automated marketing data integration
- AI-powered data processing and analysis
- Cross-channel campaign reporting
- Custom data visualization dashboards
Adverity is often used by enterprise marketing teams that manage complex advertising ecosystems.
Optimizing campaigns with paid ads analytics
Tracking campaign data is only the first step. The real value of paid ads analytics comes from using those insights to improve campaign performance over time.
Once you understand how campaigns are performing, you can identify areas where adjustments can lead to better results. This often involves testing new creatives, refining targeting, or reallocating budgets to higher-performing campaigns.
A common approach marketers use is continuous testing. By changing one variable at a time, such as the headline, image, audience, or call-to-action, teams can see which elements have the biggest impact on engagement and conversions.
Analytics data also helps identify patterns that might not be obvious at first. For example, you may notice that certain audiences convert better, or that specific campaigns perform well on certain days or devices.
Some of the most common ways marketers optimize campaigns using analytics include:
- Testing different ad creatives and messaging
- Refining audience targeting based on engagement data
- Improving landing pages to increase conversions
- Adjusting bidding strategies and budget allocation
- Pausing campaigns that generate traffic but not conversions
Over time, these adjustments help marketing teams reduce wasted ad spend and focus their budgets on campaigns that deliver the strongest results.
To sum it up
Paid ads analytics helps marketers understand which campaigns drive real results. By analyzing campaign data alongside user behavior and conversions, teams can see which ads influence signups, purchases, and revenue. This clarity makes it easier to optimize campaigns and spend budgets where they generate the most impact.
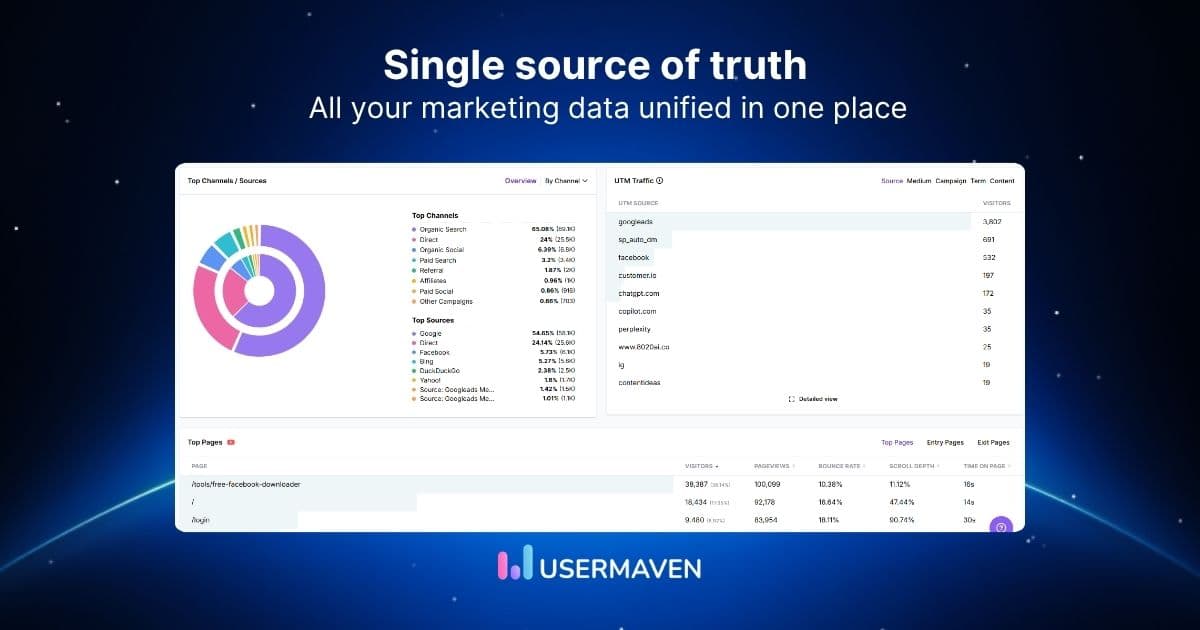
Usermaven brings campaign data, attribution insights, and website behavior into one place. As the best marketing attribution software, it helps marketers see how paid campaigns contribute to conversions and which channels influence the customer journey.
Ready to see which ads actually drive conversions?
Sign up now for a free trial or book a demo, and see where your ad spend really drives results.
FAQs
Most analytics platforms allow you to connect advertising accounts directly through integrations or APIs. Once connected, campaign data from platforms like Google Ads, Meta Ads, or LinkedIn Ads can be combined with website behavior and conversion data to analyze how ads influence user actions after the click.
2. What challenges do marketers face when analyzing paid ad performance?
One common challenge is fragmented data. Advertising metrics often live inside separate ad platforms, while website behavior and conversions are tracked elsewhere. Without connecting these data sources, it becomes difficult to understand how campaigns influence the full customer journey.
3. How does attribution help improve paid ad analysis?
Attribution analysis shows how different campaigns contribute to conversions across the customer journey. Instead of crediting only the last interaction, attribution models help marketers see which ads assist conversions and influence purchasing decisions.
4. Can paid ads analytics help reduce wasted ad spend?
Yes. By analyzing campaign data and conversion patterns, marketers can identify ads that generate traffic but do not lead to meaningful actions. This makes it easier to pause underperforming campaigns and reallocate budgets toward strategies that drive better results.
5. How can marketers analyze campaigns running on multiple ad platforms?
To analyze campaigns across multiple channels, marketers usually combine data from different advertising platforms into a centralized analytics or reporting tool. This allows teams to compare campaign performance across channels and identify which platforms contribute most to conversions.
6. What role does automation play in paid ads analytics?
Automation helps collect and organize campaign data more efficiently. Many analytics platforms automatically track events, update dashboards, and surface insights that help marketers quickly identify performance trends and optimization opportunities.
![Paid ads analytics: How to track performance [10 best tools]](/_next/image?url=https%3A%2F%2Fstaging-blog.usermaven.com%2Fwp-content%2Fuploads%2F2025%2F03%2FPaid-ad-analytics.jpg&w=1920&q=75)