Numbers rarely lie. But sometimes they don’t agree.
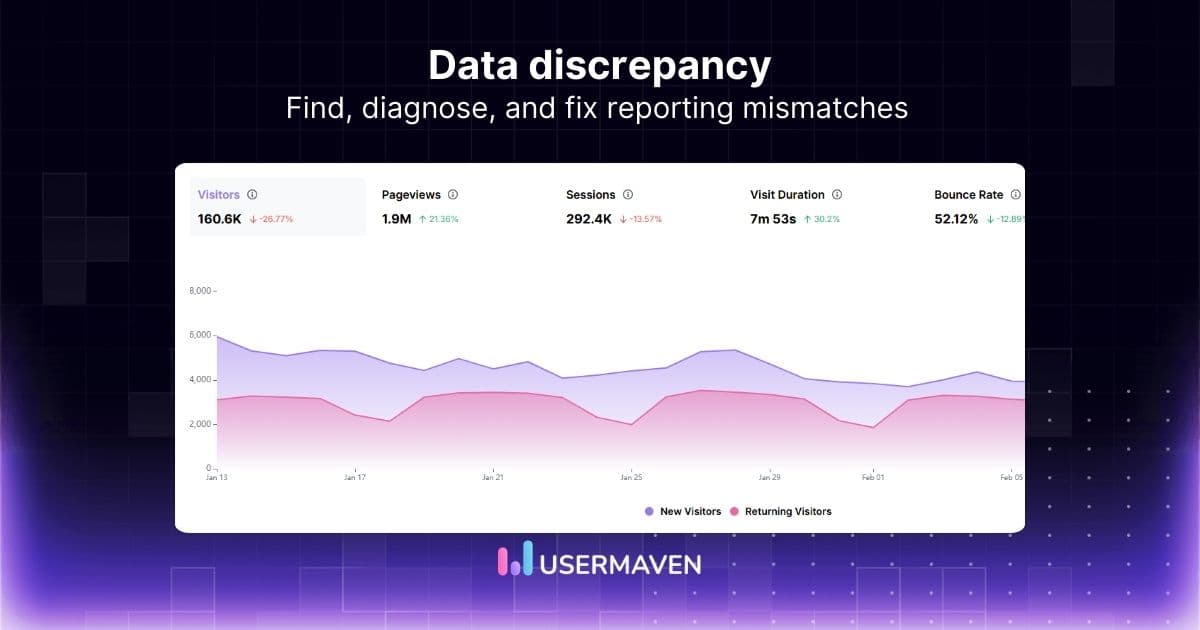
You open two analytics tools expecting the same report. One shows 10,000 visits. The other shows 8,700. Suddenly, you are left wondering which number is correct. This situation is known as a data discrepancy.
A data discrepancy happens when different systems report different values for the same metric. It can appear in website analytics, marketing dashboards, ad platforms, or internal reports.
Small differences are normal because tools measure and process data in different ways. But large discrepancies can confuse teams and lead to poor decisions.
Here, we will explain what data discrepancy means, why it happens, and how you can identify and resolve discrepancies across different platforms.
What is data discrepancy?
In practice, a data discrepancy is less about numbers being “wrong” and more about how different systems interpret and record the same activity.
Analytics tools rarely measure events in exactly the same way because they interpret clickstream data and user interactions differently.
Each platform has its own rules for things like sessions, users, conversions, and attribution. Because of these differences, two systems can analyze the same activity but produce slightly different results.
For example, one platform might count a session after every page load, while another groups multiple actions into a single session. Similarly, attribution models can assign credit for a conversion to different marketing channels depending on the tool being used.
This is why discrepancies often appear when teams compare reports from multiple platforms, such as analytics tools, ad networks, or internal databases.
The key is understanding that not every discrepancy signals a problem. Small variations are common in both quantitative and qualitative data analysis. The real challenge is identifying when the gap becomes large enough to affect reporting accuracy and decision-making.
Common causes of data discrepancies in analytics
While discrepancies often come from measurement differences, some specific technical factors frequently create gaps in analytics reports.
Below are some of the most common causes teams encounter when comparing data across platforms.
Tracking implementation issues
Tracking problems are one of the biggest reasons analytics numbers don’t match.
This can happen when:
- Tracking scripts fail to load
- Events are configured incorrectly
- Tags fire multiple times
- Tracking is missing on certain pages.
When data collection is inconsistent, different tools may capture different portions of user activity.
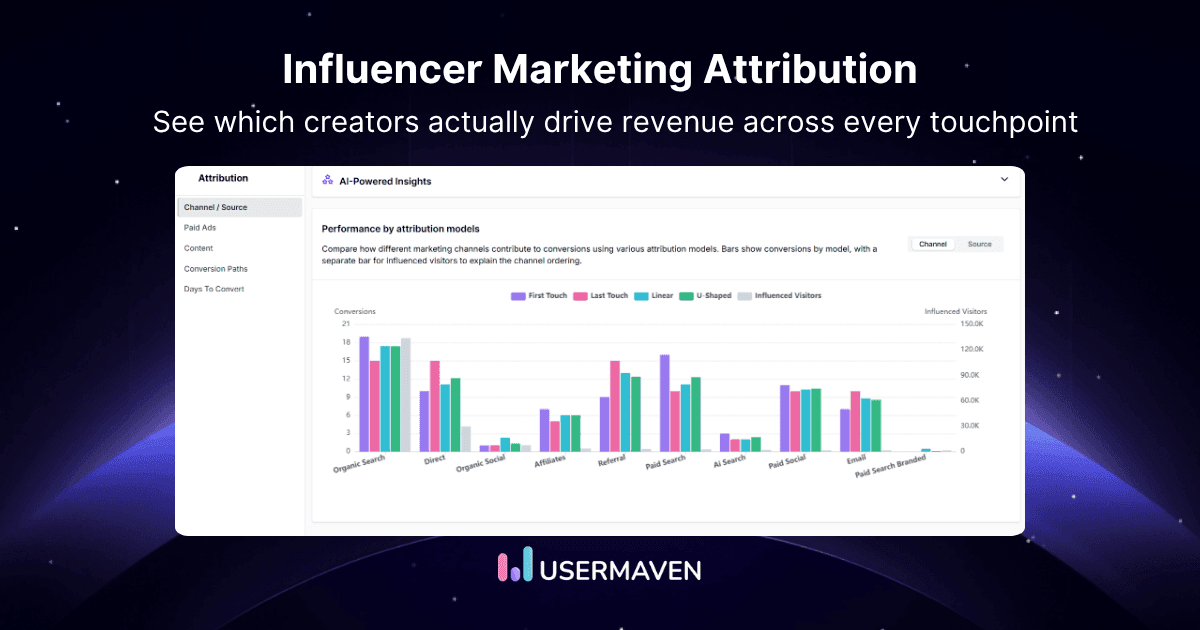
Attribution model differences
Marketing platforms often assign credit for conversions using different data-driven attribution models.
Common models include:
Because each model distributes credit differently, conversion numbers can vary across platforms.
Time zone mismatches
Analytics tools often use different time zone settings.
For example:
- One tool may track activity in UTC
- Another may use your business time zone
As a result, events can appear on different dates when reports are compared.
Privacy restrictions and ad blockers
Modern privacy settings can prevent analytics scripts from firing.
These include:
- Ad blockers
- Browser privacy protections
- Cookie consent restrictions
When tracking is blocked, some platforms may miss user activity entirely, which can also affect how accurately first-party data is collected.
Data sampling
Some analytics platforms sample large datasets to improve reporting speed.
When sampling occurs:
- Only a portion of the data is analyzed
- Estimates are used for reporting
This can create discrepancies when compared with tools that use full datasets.
Integration or API delays
When data flows between tools through APIs or integrations, delays or sync issues can cause temporary discrepancies between reports.
For example:
How data discrepancies affect business decisions
Small data discrepancies are usually harmless. But when the gap between numbers becomes large, it can start to affect how teams interpret performance and make decisions.
Here are some ways discrepancies in data can impact a business:
- Misleading performance reports
If different tools report different numbers, teams may struggle to understand what is actually happening. This can make it harder to evaluate marketing campaigns, product performance, or user behavior.
- Poor decision-making
When teams rely on inaccurate or inconsistent data, they may invest in the wrong strategies. For example, a marketing channel might look successful in one report but underperform in another.
- Confusion across teams
Marketing, product, and analytics teams often use different platforms. When the numbers do not match, it can lead to debates about which report is correct instead of focusing on insights.
- Delayed analysis and reporting
Analysts may spend hours investigating why numbers don’t match instead of working on meaningful insights and improvements.
- Loss of confidence in data
Frequent discrepancies can make stakeholders question the reliability of reports, which weakens trust in data-driven marketing decision-making.
[insight_growth]
Types of data discrepancy
Not all data discrepancies happen for the same reason. In analytics and reporting, discrepancies usually fall into a few common categories. Understanding these types can help teams identify where the issue is coming from.
#1 Logical discrepancies
Logical discrepancies occur when different systems interpret the same event differently.
For example, two analytics tools may define a session or conversion in different ways. Even if they track the same user activity, their internal logic may produce slightly different numbers.
#2 Data collection discrepancies
These happen when platforms collect data using different tracking methods.
Common causes include:
- Tracking scripts failing to load
- Ad blockers or privacy tools
- Cookie consent restrictions
- Differences between web and mobile tracking
Because of these factors, some user activity or voluntarily shared information like zero-party data may only be recorded by one platform.
#3 Data processing discrepancies
After data is collected, platforms process it using their own rules. These rules can affect how numbers appear in reports.
Examples include:
- Filtering bot traffic
- Removing duplicate events
- Sampling large datasets
- Applying attribution models
If two platforms process the same data differently, their reports will not match exactly.
#4 Human or operational discrepancies
Sometimes discrepancies are caused by simple setup or operational issues. In many cases, they occur when teams lack clear data governance policies for tracking standards, metric definitions, and reporting practices.
Examples include:
- Incorrect tracking configuration
- Inconsistent event naming
- Manual data entry mistakes
- Incomplete integrations between tools
In teams that rely heavily on manual reporting or spreadsheet updates, even small entry mistakes can create discrepancies. Some organizations reduce these errors by using a data entry virtual assistant to handle repetitive data input and validation tasks.
How to identify discrepancies in data
Data discrepancies are not always obvious at first. They often appear when teams compare reports across multiple platforms. Identifying them early helps prevent incorrect analysis and reporting.
Here are some practical ways to spot discrepancies in data.
One of the easiest ways to detect discrepancies is by comparing the same metric across different tools.
For example, you might compare:
- Website traffic in your analytics platform
- Conversions in your CRM
- Campaign performance in your ad platform.
If the numbers differ significantly, it may indicate a discrepancy in the data, especially when reports rely on different data segmentation rules.
Look for unusual spikes or drops
Sudden changes in metrics can signal tracking issues or reporting inconsistencies.
For example:
- A sharp drop in traffic
- An unexpected spike in conversions
- Missing data for specific days.
These patterns often suggest that something changed in tracking or data collection.
Check for outliers in datasets
Outliers can reveal discrepancies that are hidden within large datasets, especially when reports are analyzed using data visualization tools.
If a particular data point looks very different from the rest of the data, it may indicate:
- Duplicate tracking
- Missing events
- Incorrect values
Reviewing these outliers can help identify where the discrepancy originates.
Verify data sources
It is also important to confirm that the data comes from reliable and properly configured sources.
This includes checking:
- Tracking implementation
- Integrations between platforms
- Event configuration and naming.
Ensuring that the source data is accurate makes it easier to detect and manage discrepancies.
When comparing data across platforms, it’s common to notice that the numbers don’t match perfectly. Each platform collects and reports data using its own tracking methods, attribution models, and reporting rules.
Understanding these differences can help teams interpret reports more accurately.
Meta often reports more conversions than website analytics tools. This is because Meta can track user interactions both within its platform and across devices.
Some factors that influence these discrepancies include:
- View-through conversions
- Longer attribution windows
- Cross-device tracking
- Delayed conversion reporting
Because of this, conversions reported in Meta Ads may not always match those recorded in your analytics dashboard.
Apple Search Ads
Discrepancies can also appear when comparing Apple Search Ads data with analytics or mobile attribution platforms.
Common reasons include:
- Differences in click and install attribution
- Time zone differences
- Delayed reporting updates
These factors can cause slight variations in how campaign performance is reported.
Google Ads
Google Ads may also report different conversion numbers compared with website analytics tools.
This usually happens because of:
For example, Google Ads may attribute a conversion to an ad interaction even if the user completed the action later through another channel.
Methods for resolving discrepancies in data
Once a discrepancy is identified, the next step is figuring out how to resolve it. In many cases, the issue can be traced back to differences in tracking setup, reporting configurations, or data processing rules.
Here are some practical methods teams use for resolving discrepancies in data.
Verify your tracking setup
Start by reviewing how data is being collected across your platforms.
Check for issues such as:
- Missing or duplicated tracking scripts
- Incorrectly configured events
- Tags firing multiple times
- Tracking is not implemented on certain pages
A small setup issue can easily create noticeable discrepancies in reports.
Different platforms may use different definitions for metrics such as sessions, users, or conversions.
When comparing reports, make sure you are comparing the same metrics with the same definitions. This helps prevent confusion when numbers appear inconsistent.
Compare time ranges and settings
Before analyzing discrepancies, confirm that reports use the same:
- Date range
- Time zone settings
- Filters and segments
Even a small configuration difference can affect reported numbers.
Cross-check multiple data sources
Comparing multiple datasets can help identify where the discrepancy originates.
For example, teams may compare:
- Analytics platform reports
- CRM data
- Advertising platform dashboards.
This approach helps determine which system is capturing the most reliable data.
Create a clear data tracking plan
A structured data tracking plan is an essential part of effective data management and helps reduce data quality risks before discrepancies appear.
This usually includes:
- Standardized event definitions
- Consistent naming conventions
- Documentation for tracking implementation.
Having a clear tracking framework makes it easier to maintain accurate reporting across platforms.
[insight_growth]
Conclusion
Data discrepancies are common when multiple systems measure the same activity in different ways. Differences in tracking methods, attribution models, and reporting rules can all lead to numbers that don’t perfectly match. Understanding these differences helps teams interpret data more accurately and avoid misleading conclusions.
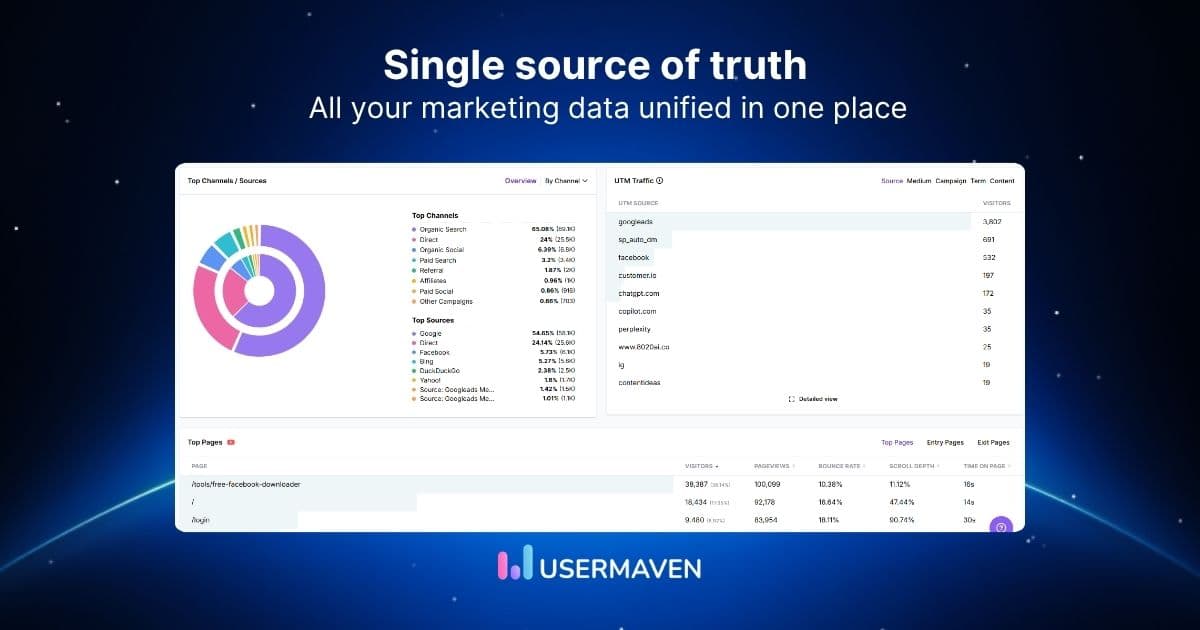
Usermaven helps reduce these inconsistencies by providing a unified website analytics tool that standardizes tracking, attribution, and reporting across platforms. With clearer event tracking and consistent data collection, teams can manage data discrepancies more effectively and rely on more accurate analytics.
Want clearer reports and fewer data discrepancies?
Start a free trial or book a demo today and turn confusing reports into clear insights you can trust.
FAQs
1. What is the difference between data discrepancy and data error?
A data discrepancy refers to a difference between datasets that measure the same activity. It does not necessarily mean the data is incorrect.
In many cases, discrepancies occur because systems use different tracking methods, definitions, or attribution rules. A data error, on the other hand, usually indicates a mistake such as missing records, incorrect values, or faulty data processing.
2. Why do analytics tools report different numbers?
Analytics tools often report different numbers because they collect and process data differently. Some platforms rely on browser tracking while others use server-side tracking or modeling. Differences in attribution windows, filtering rules, and privacy restrictions can also affect how metrics like sessions, users, and conversions are reported.
3. When should a data discrepancy be investigated?
A discrepancy should be investigated when the difference between datasets is large enough to affect reporting or decision-making.
Small variations are common in analytics, but significant gaps may indicate issues such as tracking failures, incorrect event configuration, or integration problems between platforms.
4. How do you test data discrepancy?
Testing for data discrepancies typically involves validating data across multiple sources. Analysts may compare reports from analytics tools, CRM systems, and advertising platforms to identify inconsistencies. Running test events, reviewing tracking logs, and auditing event configurations can also help confirm whether data is being captured correctly.
5. Is data discrepancy normal in analytics?
Yes, small discrepancies are common when comparing analytics platforms. Different tools use unique tracking methods, filters, and attribution models, which can lead to slight variations in reported metrics. Most teams focus on consistent trends rather than expecting identical numbers across all platforms.
6. What is an acceptable level of data discrepancy?
In many analytics scenarios, a difference of 5–10% between platforms is generally considered normal. Larger discrepancies may indicate tracking configuration issues, attribution differences, or missing data and should be investigated further.
7. How can businesses prevent data discrepancies?
Businesses can reduce discrepancies by maintaining consistent tracking setups, documenting metric definitions, aligning attribution models across tools, and regularly auditing their analytics implementation. Clear data governance practices also help ensure more reliable reporting across platforms.