Vertical SaaS lives and dies by two numbers: how many customers you add, and how many you keep.
Most teams fixate on growth, but in 2026, retention is where the real pressure sits. Acquisition costs continue to rise, competition in service-based software keeps tightening, and churn erodes margins faster than most dashboards admit.
If you do not spot churn signals early, well before a cancellation ticket lands in support, your CAC-to-LTV math falls apart. By the time a customer explicitly says they are leaving, the opportunity to course-correct has often passed.
This guide explains how vertical SaaS teams can use retention analytics to detect churn before it becomes obvious. We focus on operational workflows like bookings, dispatch, and job completion, where real product value is delivered in service-based platforms. When these workflows are tracked properly, they act as early signals of customer health rather than lagging reports.
What retention analytics means for vertical SaaS
Retention analytics in vertical SaaS is the practice of measuring how consistently customers complete the core workflows that drive value in a service-based product over time.
Instead of relying on surface-level engagement metrics like logins or active seats, retention analytics tracks operational events such as job creation, dispatch, completion, and billing. These signals show whether the product is embedded in day-to-day operations or slowly being abandoned.
By analyzing patterns across workflow intensity, breadth, and recency, vertical SaaS teams can identify early churn risk, prioritize at-risk accounts, and intervene before cancellations or downgrades occur. Analytics platforms like Usermaven help centralize these signals by capturing event-level data across web, product, and integrations in a consistent, privacy-friendly way.
Why retention looks different in vertical SaaS
Horizontal SaaS lives on logins and seats; vertical SaaS lives on operational workflows. For example, handyman software solutions can’t judge engagement simply by “monthly active users.” It needs to know if job photos were uploaded, invoices sent, appointment reminders dispatched, and work orders completed.
This workflow intensity creates three differences in how we analyze retention:
Seasonality and job cadence matter more than frequency alone. A weekly drop in activity may be normal in one quarter and a churn signal in another.
Multiple personas create uneven usage patterns. Owners, dispatchers, and field staff interact with the product differently, and aggregating them hides risk.
External success metrics matter. Completed jobs and paid invoices often live outside the core product and must be joined through integrations or event pipelines.
Benchmarks support this distinction. While median B2B SaaS churn often sits around 15 percent annually, deeply embedded vertical SaaS products can maintain churn closer to 10 to 12 percent. Tools that fail to integrate into daily operations often see churn spike beyond 20 percent. Understanding where you fall on that spectrum starts with mapping workflows, not counting logins.
Website analytics tool for modern marketers & agencies
*No credit card required
Spotting workflow-level churn signals
Service-based products show their intent to cancel long before the credit card fails. The clues hide in job-cycle events:
Work orders created
Dispatch accepted
Field forms completed
Invoice sent and paid
A consistent drop in any of these steps, normalized for seasonality, is a strong early warning. For example, a meaningful decline in work orders created compared to the same period last year can predict churn 30 days in advance.
This is where domain-specific funnels become critical. A typical service SaaS funnel might look like:
Work order created → Technician assigned → On-site check-in → Job completed → Invoice paid
Each step should be tracked as an event in your analytics tool. Platforms like Usermaven allow teams to model these funnels across tenants and cohorts, making it easier to see where workflow breakdowns occur and which accounts need attention.
A concrete example comes from the home-services space. Platforms positioning themselves as “handyman software solutions”, for instance, Field service software for HVAC businesses often see first-month churn driven by an empty estimate backlog. Newly signed contractors get busy, postpone setup, never import contacts, and silently disappear. Tracking “first estimate created within seven days” gives your CSM a trigger to jump in and help with
Instrumenting an analytics stack that sees leading indicators
Predicting churn without clean, event-level data is unreliable. Vertical SaaS teams need analytics instrumentation that captures operational reality, not just UI interactions.
For service-based products, the most important signals typically include:
Core object events such as jobs, customers, and invoices
Status transitions like scheduled, dispatched, and completed
Mobile and field signals, including check-ins, uploads, and payment collection
The first step is ensuring these events are captured with consistent timestamps, account identifiers, and properties. An analytics platform like Usermaven can serve as a centralized layer to track these events across web and product experiences without heavy manual setup.
The second step is connecting usage data with billing, support, and lifecycle signals. Retention analytics becomes far more accurate when product behavior is analyzed alongside revenue trends and support interactions. This unified view helps teams detect churn risk earlier, rather than reacting after revenue is already lost.
Human input still matters. Customer success teams often sense when an account feels unstable. Capturing these signals as structured data alongside behavioral analytics creates a stronger retention model than either approach alone.
From raw events to predictive health scores
Having events is not the same as knowing what matters. The next step is building a health-score formula that blends intensity, breadth, and recency. A basic yet powerful version looks like
Health Score = 0.4I + 0.3B + 0.3R
where
I = Intensity (median weekly jobs per active seat vs. historical peak)
B = Breadth (percentage of core modules used this month)
R = Recency (days since last core event, scaled 0-100)
These dimensions can be weighted differently depending on the vertical. Dispatch-heavy platforms may prioritize intensity, while multi-module products may emphasize breadth. Tools like Usermaven make it easier to experiment with these weights by analyzing historical retention patterns across cohorts.
Over time, teams can layer in more advanced analysis, such as regression models or survival curves. Even basic scoring models, when consistently applied, produce actionable lists of at-risk accounts that teams can test and refine.
Turning insights into retention plays
Analytics is the compass; you still need to steer the ship. Progressive CS and growth teams attach plays to each churn signal:
Low estimate creation – automate a “Need help building your first quote?” in-app assistant; escalate to a calendar link with a setup specialist if no action in 24 h.
Drop in dispatcher logins – push a micro-survey asking if technicians are still using mobile check-ins; offer a quick retraining video.
Slow invoice payment – surface best-practice content on same-day billing; upsell integrated payments if still on manual export.
A critical mindset shift is moving from retention as support to retention as product-led growth. Give users reasons to expand (additional modules, more seats) at the exact moment you solve their first frustration. This is how leading vertical SaaS companies achieve negative net churn, with expansion revenue outpacing downgrades and cancellations.
Usermaven supports this approach by enabling teams to track behavior at the account and segment level, making it easier to trigger timely, relevant interventions.
Behavioral playbooks beat discounts
It’s tempting to offer a last-minute discount when a customer signals they are about to leave. Resist that impulse. Discounts train customers to negotiate at renewal instead of engaging more deeply with the product.
A stronger approach is to surface the behavioral signal behind the dissatisfaction. For example, pointing out that close-out times have increased and explaining how that often leads to cash-flow delays reframes the conversation around outcomes, not price.
Analytics-backed conversations create alignment. Instead of bargaining, teams collaborate with customers to fix the workflow issues that triggered churn risk in the first place.
Common pitfalls and how to avoid them
Even mature SaaS teams make mistakes with customer retention analytics. Common issues include:
Aggregating different personas into one usage number. Field techs may log in once per job, while office admins live in the app all day. Separate cohorts, or your averages lie.
Ignoring offline success metrics. If technicians collect cash or checks, invoice events alone won’t reflect health. Bring in accounting or bank reconciliation data.
Treating cancellations as the only churn indicator. Contract downgrades or seat reductions erode ARR quietly. Track net revenue retention month over month.
Building a health score and never revisiting it. Market conditions change; so should your coefficients. Retrain quarterly.
Overfitting fancy ML models. A model that nails last year’s data but misses next quarter’s reality helps nobody. Simpler, interpretable scores often outperform black boxes, especially with smaller customer counts.
How to measure the success of your retention program
To measure whether your SaaS retention analytics efforts are actually working, start by defining a small set of clear, outcome-driven metrics. These should reflect both early intervention and long-term revenue impact.
Set gross dollar retention (GDR) targets Track how much existing revenue you retain over time to understand whether retention initiatives are actually reducing revenue loss.
Measure response-time SLAs for at-risk accounts Monitor how quickly teams act after churn prediction or detection. Faster outreach often leads to higher save rates.
Track coverage of documented retention plays Ensure that each major churn driver identified through analytics has a clear, repeatable action tied to it.
Evaluate health-score accuracy over time Review how well your retention models predict customer churn risk and refine them as customer behavior and workflows evolve.
Capture customer feedback tied to proactive outreach Quantitative retention metrics tell part of the story, but qualitative feedback matters too. Comments that reference timely support or analytics-driven intervention help validate the real-world impact of your retention program.
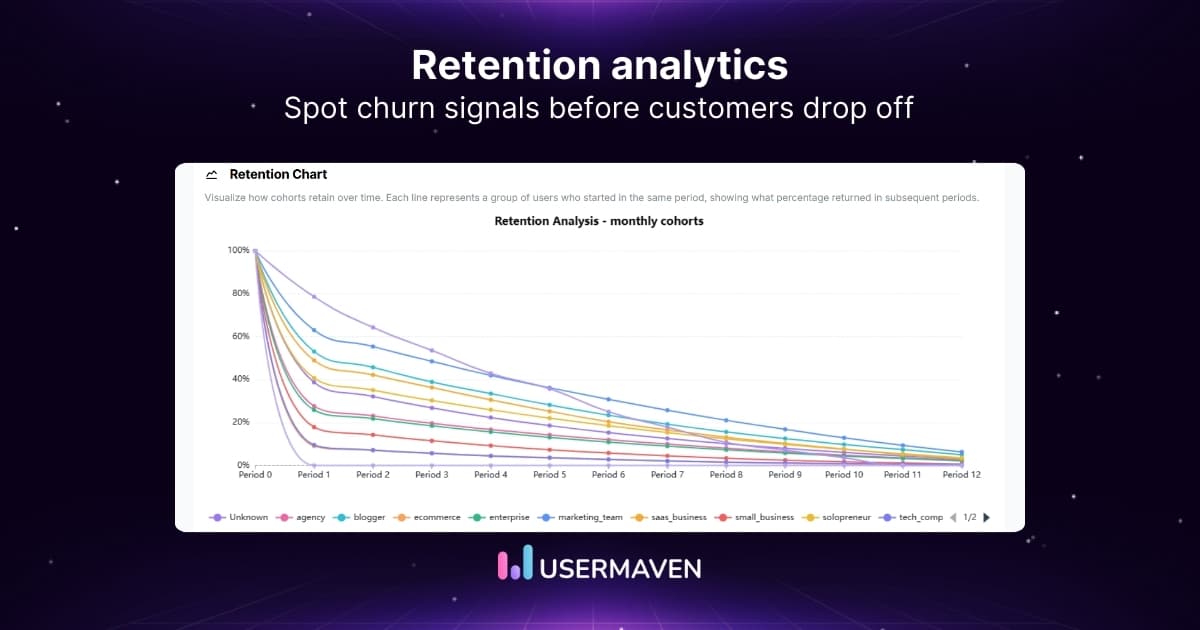
Applying retention and cohort analysis with Usermaven
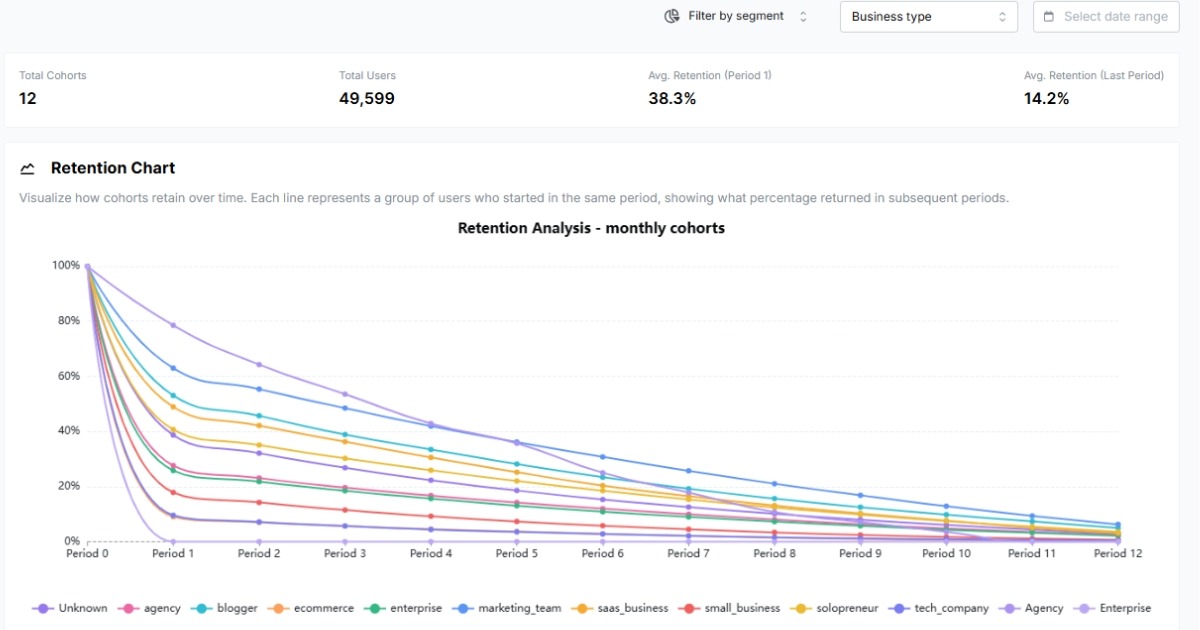
Retention analytics becomes far more effective when teams can analyze behavior over time, not just in isolated snapshots. This is where cohort-based analysis plays a critical role for vertical SaaS products.
Usermaven supports retention analysis by allowing teams to group users or accounts into cohorts based on tracked events and properties, such as signup timing, feature usage, or key workflow actions. This makes it possible to move beyond simple activity checks and understand how engagement evolves across different segments over time.
With Usermaven, vertical SaaS teams can use retention and cohort analysis to:
Analyze retention based on key product events Compare retention trends between users or accounts that complete important actions and those that do not, helping teams identify which behaviors correlate with long-term usage.
Evaluate onboarding and activation patterns Use cohorts to understand how different onboarding experiences or early usage paths affect retention over weeks or months.
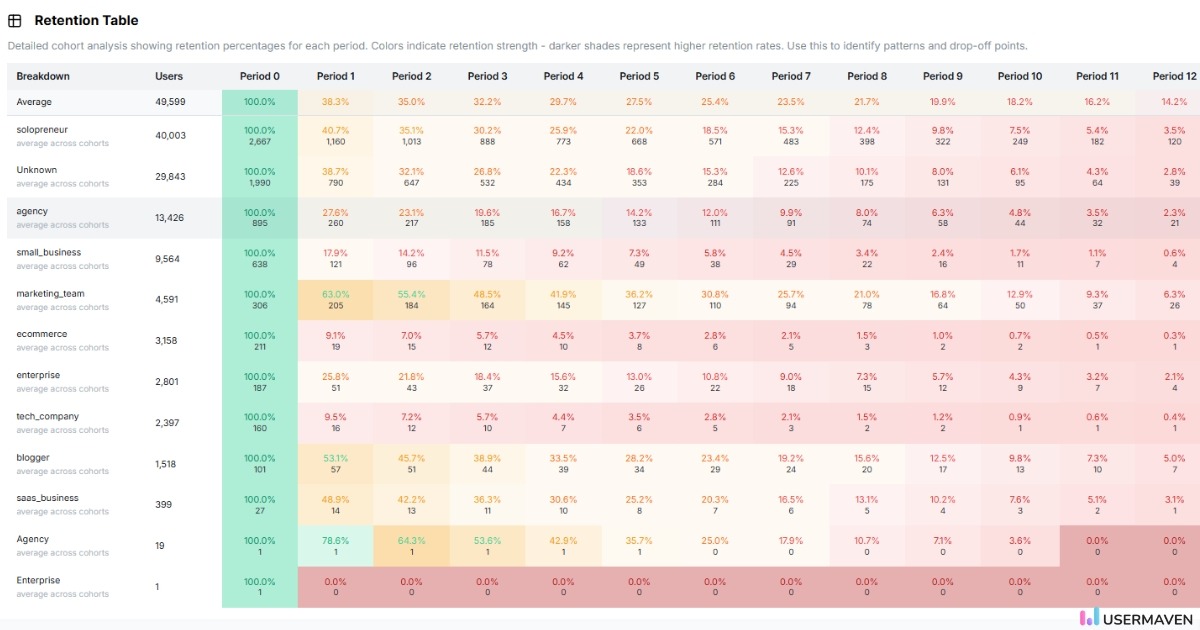
Segment retention by meaningful attributes Break down retention trends by properties such as account type, plan, or role-related attributes that are tracked within the product, avoiding misleading averages.
Assess retention trends after product changes Compare cohorts before and after releases or workflow updates to understand how changes influence ongoing engagement.
Because Usermaven focuses on event-based tracking across web and product interactions, teams can connect retention trends directly to observed user behavior. This helps vertical SaaS teams move from reactive churn analysis to a more proactive, data-informed approach to retention optimization, without relying on invasive tracking or guesswork.
To sum it up,
Vertical SaaS is booming, projected to hit $441B by 2027, but that growth masks a hard reality. Switching costs are falling, competitors are launching feature-parity products faster than ever, and retention has become the real differentiator. Teams that understand workflow behavior, detect churn early, and act on meaningful signals turn retention into a durable competitive advantage.
The right analytics foundation matters when retention is on the line. Usermavenhelps vertical SaaS teams understand retention through event-based analytics, cohort analysis, and behavioral insights across web and product experiences. As a privacy-friendly website and product analytics tool, Usermaven connects real user behavior to retention outcomes so teams can make smarter decisions with confidence.
Want to spot churn earlier and build products your customers rely on?
Book a demo to see Usermaven in action, or sign up for free and start using retention analytics that deliver real impact.
[usermaven_in_action]
FAQs
1. What is the difference between retention analytics and churn analytics?
Retention analytics focuses on understanding why users continue to engage with a product over time, while churn analytics concentrates on why users leave. Retention analytics is proactive and behavior-driven, whereas churn analytics is often reactive and outcome-based.
2. How long does it take to see results from retention analytics?
Results from retention analytics typically emerge over weeks or months, depending on customer lifecycle length. Early indicators such as improved activation or reduced inactivity often appear before measurable changes in churn or revenue retention.
3. Is retention analytics only useful for large SaaS companies?
No. User retention analytics is valuable for SaaS companies of all sizes. Smaller teams often benefit the most because early retention improvements have an outsized impact on growth efficiency and customer lifetime value.
4. What data do you need to get started with retention analytics?
At a minimum, teams need consistent event data tied to users or accounts and timestamps. Even a small set of meaningful product events can provide useful retention insights when analyzed over time.
5. How often should retention analytics models or reports be reviewed?
Retention analytics should be reviewed regularly, typically on a monthly or quarterly basis. As customer behavior, pricing, or workflows change, retention assumptions and benchmarks should be adjusted accordingly.
6. Can retention analytics help with expansion and upsells?
Yes. Retention analytics can highlight which behaviors correlate with long-term usage and account growth. These insights help teams identify the right moments to introduce upgrades, add-ons, or additional seats.
A typical SaaS buying journey has nothing to do with the classic seven touches. Today, the environment is so crowded that you need to build trust, stay visible across multiple channels, and show up everywhere your buyers are researching. Most SaaS teams do not have the resources or specialist depth to do all of this […]
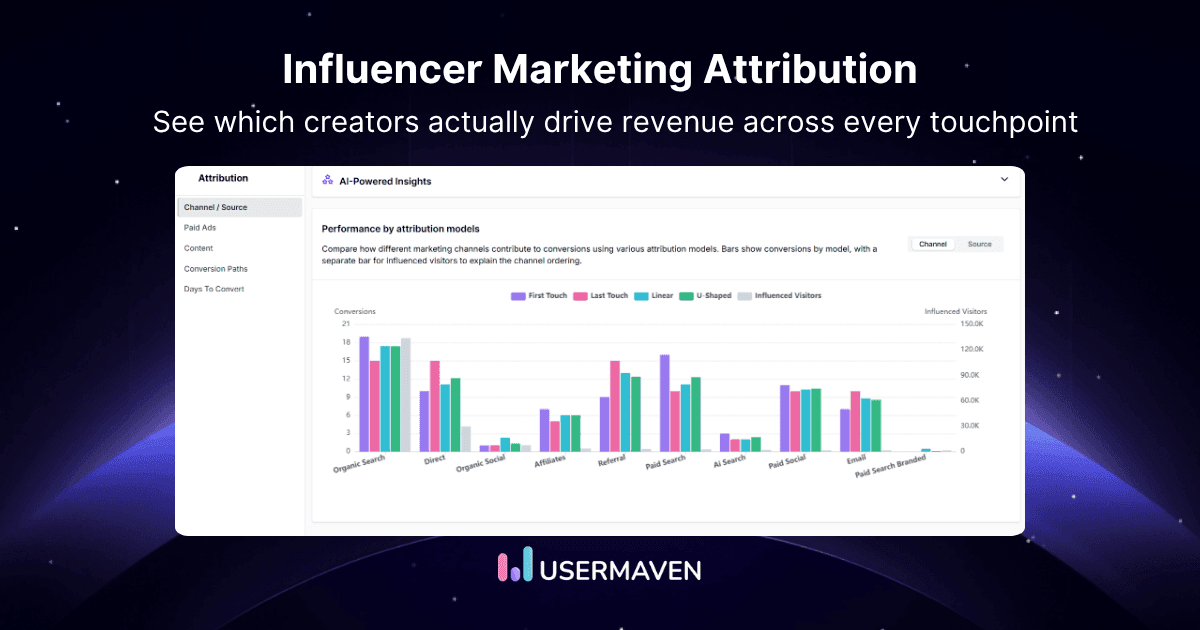
A brand runs an influencer campaign and measures 200 promo code redemptions. But 1,400 people visited the site after the campaign, searched the brand on Google, and converted without the code. The influencer drove 1,600 conversions. The brand measured 200 and cut the budget. This is the influencer attribution problem. Most brands are systematically undercounting […]
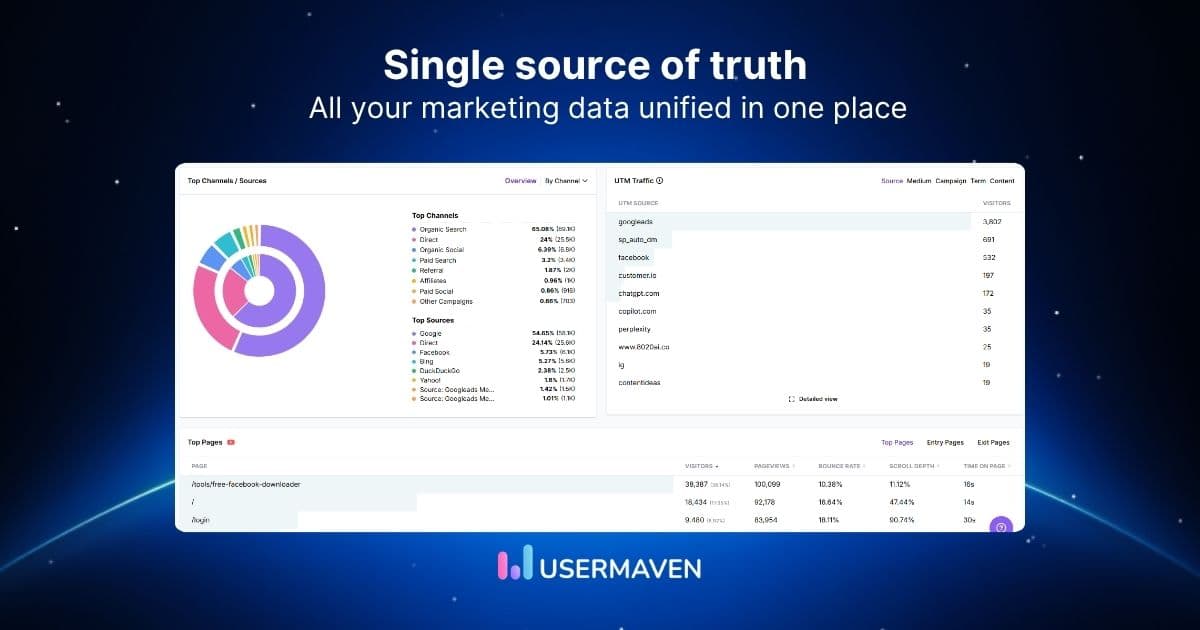
Monday morning. The marketing team opens five tools and still cannot agree on last week’s conversions. Google Ads, GA4, Meta Ads Manager, the CRM, and a revenue spreadsheet all show different numbers. The meeting ends with guesses, not decisions. A single source of truth is a shared, authoritative data layer where every important marketing and […]
By Junaid Ahmed
Jun 10, 2026
How vertical SaaS teams use retention analytics to spot churn early