In SaaS, recognizing and responding to trends is key to staying competitive. Product trend analysis helps you understand user behavior, anticipate market shifts, and make decisions that truly move the needle.
Whether it’s reducing churn, increasing feature adoption, or refining your product roadmap, trend analysis provides a clear path forward. With Usermaven, uncovering and acting on these insights becomes simpler and more effective.
Let’s get into the depth of this concept;
What is product trend analysis?
Product trend analysis involves reviewing historical and present-day information to spot consumer behavior shifts and trends in product performance. It focuses on gathering data from multiple angles – both internal records (like sales and web analytics) and external sources (like social media chatter and industry surveys) – to uncover patterns that drive informed decisions.
Why should this matter to you?
It’s one of the best ways for a company to protect itself against uncertainty and spot opportunities ahead of the competition. By following these patterns, you can adapt product features, refine marketing strategies, and allocate budgets in a way that aligns with real user needs and improve product engagement.
Usermaven helps you do this by offering a single platform where you can track usage, analyze behaviors, and observe how changes in the market might affect your product. Its automatic event tracking feature captures user interactions with no manual setup. That cuts down on clutter and allows teams to spend more time on insights.
The fundamental types of trend analysis
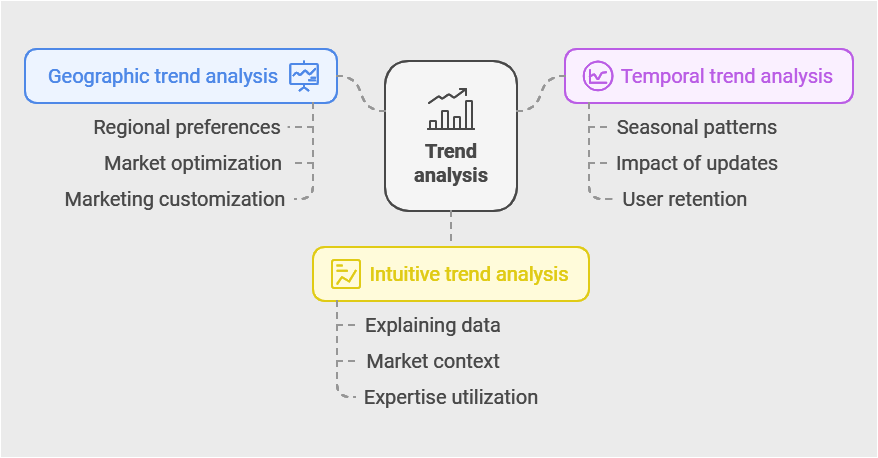
When we dive into trend analysis, three primary approaches emerge, each serving different analytical needs:
Geographic trend analysis:
This approach examines how product performance and user behavior vary across different locations. Imagine running an e-commerce platform and discovering that users in different regions have distinctly different shopping patterns – this is where geographic trend analysis shines. It helps you:
- Identify regional preferences and usage patterns
- Optimize product offerings for specific markets
- Guide international expansion strategies
- Customize marketing approaches by region
Temporal trend analysis:
Time-based analysis helps you understand how your product metrics change over different periods. This is particularly crucial for:
- Identifying seasonal patterns in user behavior
- Measuring the impact of product updates
- Understanding user retention over time
- Predicting future trends based on historical patterns
Intuitive trend analysis:
This approach combines quantitative data with qualitative insights and industry expertise. It’s particularly valuable because:
- It helps explain the “why” behind the numbers
- Incorporates market context and external factors
- Leverages team expertise and industry knowledge
- Provides a more holistic view of trends
Core components of effective trend analysis
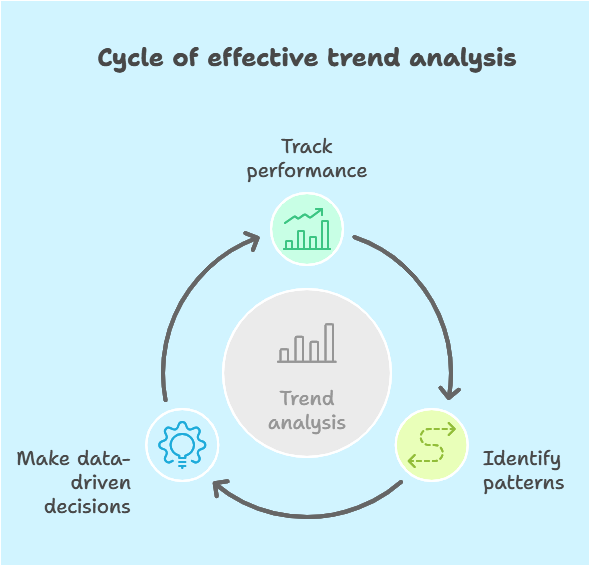
Successful trend analysis isn’t just about collecting data – it’s about understanding the relationship between different metrics and what they mean for your product. Key components include:
Performance tracking:
Understanding how your key metrics change over time is fundamental. This involves:
- Monitoring user engagement rates
- Tracking feature adoption
- Analyzing conversion metrics
- Measuring customer satisfaction indicators
Pattern identification:
Looking for recurring patterns in your data helps predict future trends and understand user behavior:
- Seasonal usage patterns
- User behavior cycles
- Feature adoption curves
- Churn indicators
Data-driven decision-making:
The ultimate goal is to use these insights to make better business decisions:
- Product development prioritization
- Resource allocation
- Marketing strategy adjustment
- Customer experience improvements
Quick note: If you’re comparing tools to support analysis and execution, our Black Friday SaaS deals roundup is a useful reference list of popular SaaS products that teams evaluate.
Implementing trend analysis with Usermaven
Trend analysis is a powerful way to drive growth, and Usermaven makes it seamless with its comprehensive trends feature. Here’s how it works, structured for clarity and actionable insights.
Usermaven simplifies trend analysis through three key processes:
1. Data collection and organization
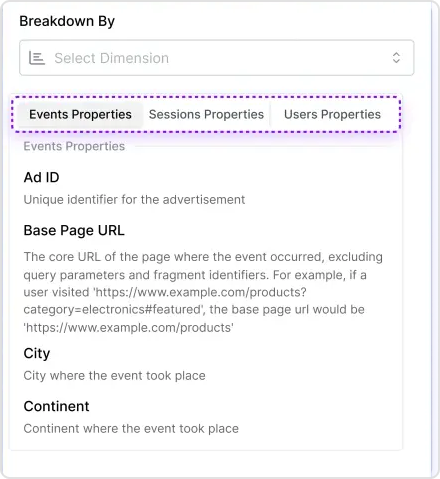
Usermaven ensures a comprehensive data collection process to capture all relevant user activity, including:
- User interactions and events: Track specific user actions.
- Session information: Understand session duration and engagement.
- Geographic data: Analyze user distribution by region.
- Device and browser details: Identify key platforms for optimization.
- Marketing channel attribution: Measure acquisition channel effectiveness.
2. Analysis and visualization
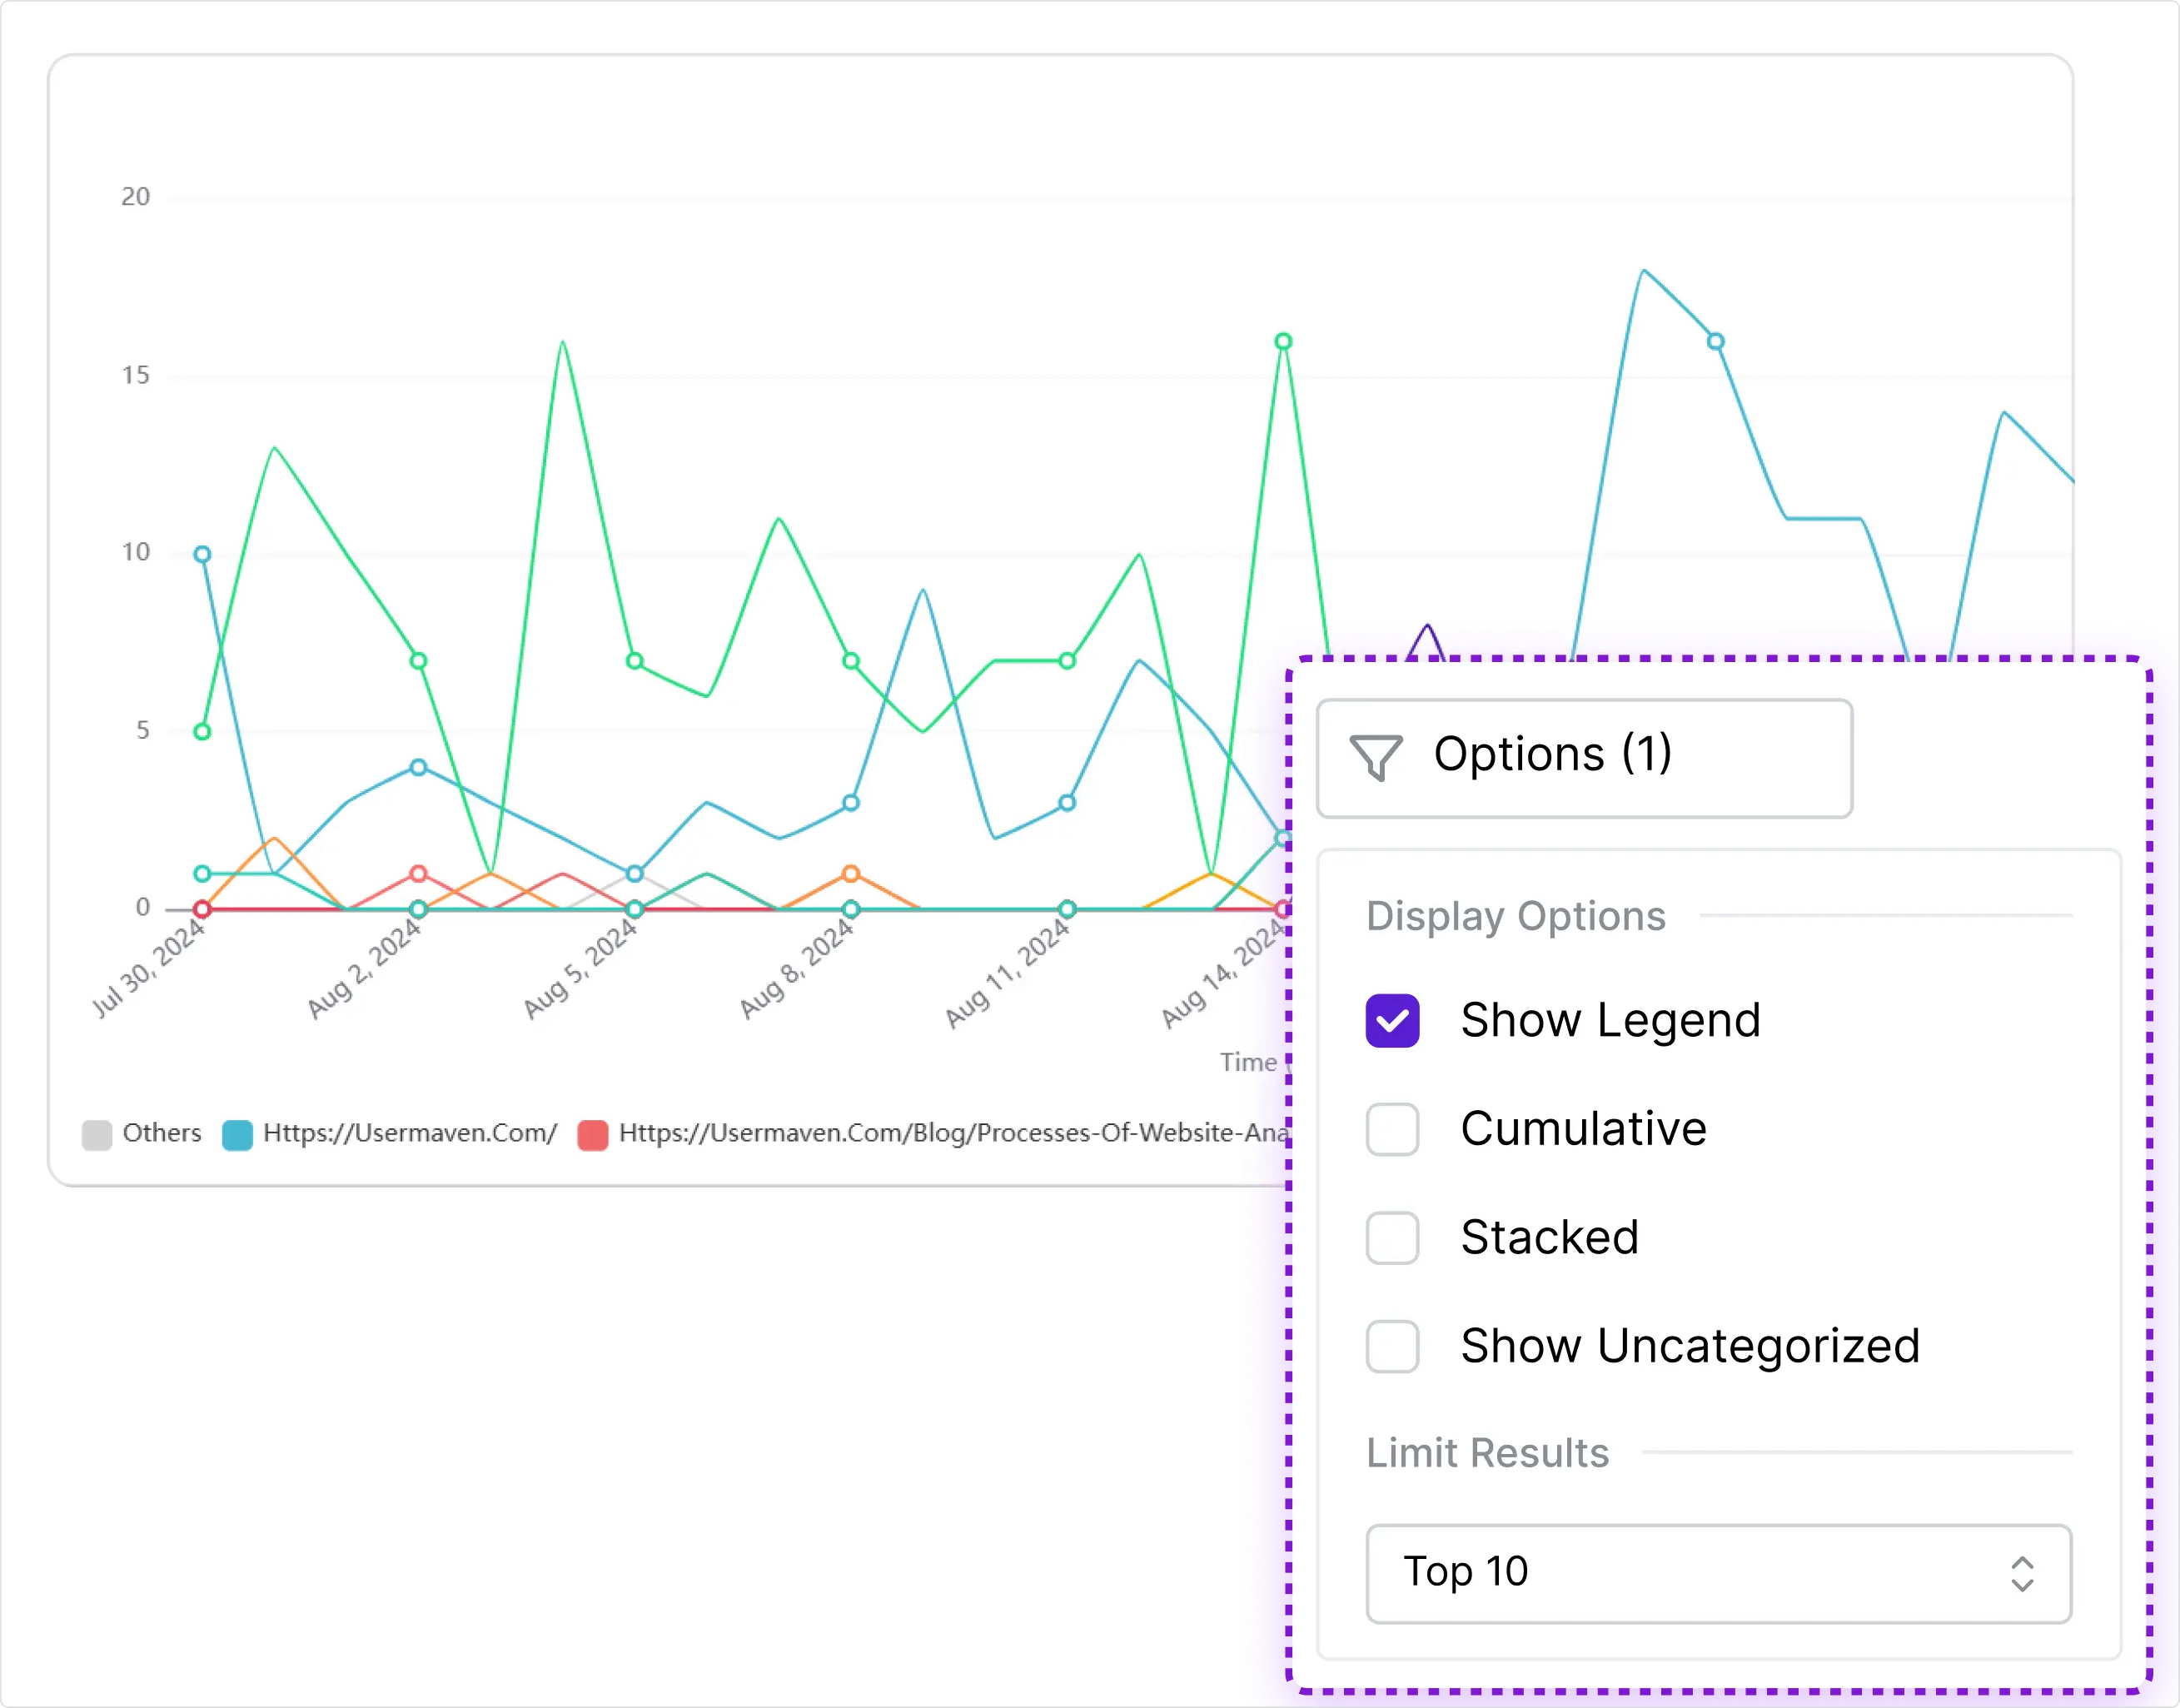
Usermaven provides tools to analyze and present data effectively:
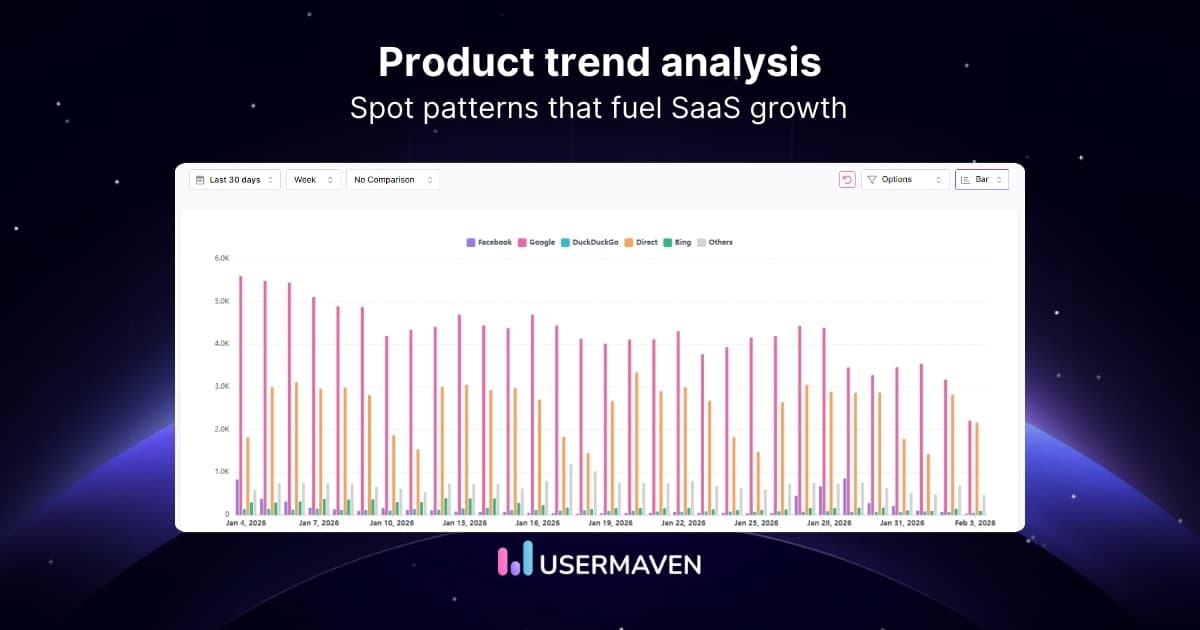
- Chart types: Choose from line, bar, and pie charts for different needs.
- Custom metric combinations: Create tailored metrics for specific insights.
- Granular filtering options: Drill down into detailed segments.
- Real-time data updates: Access the latest performance metrics instantly.
3. Action and implementation
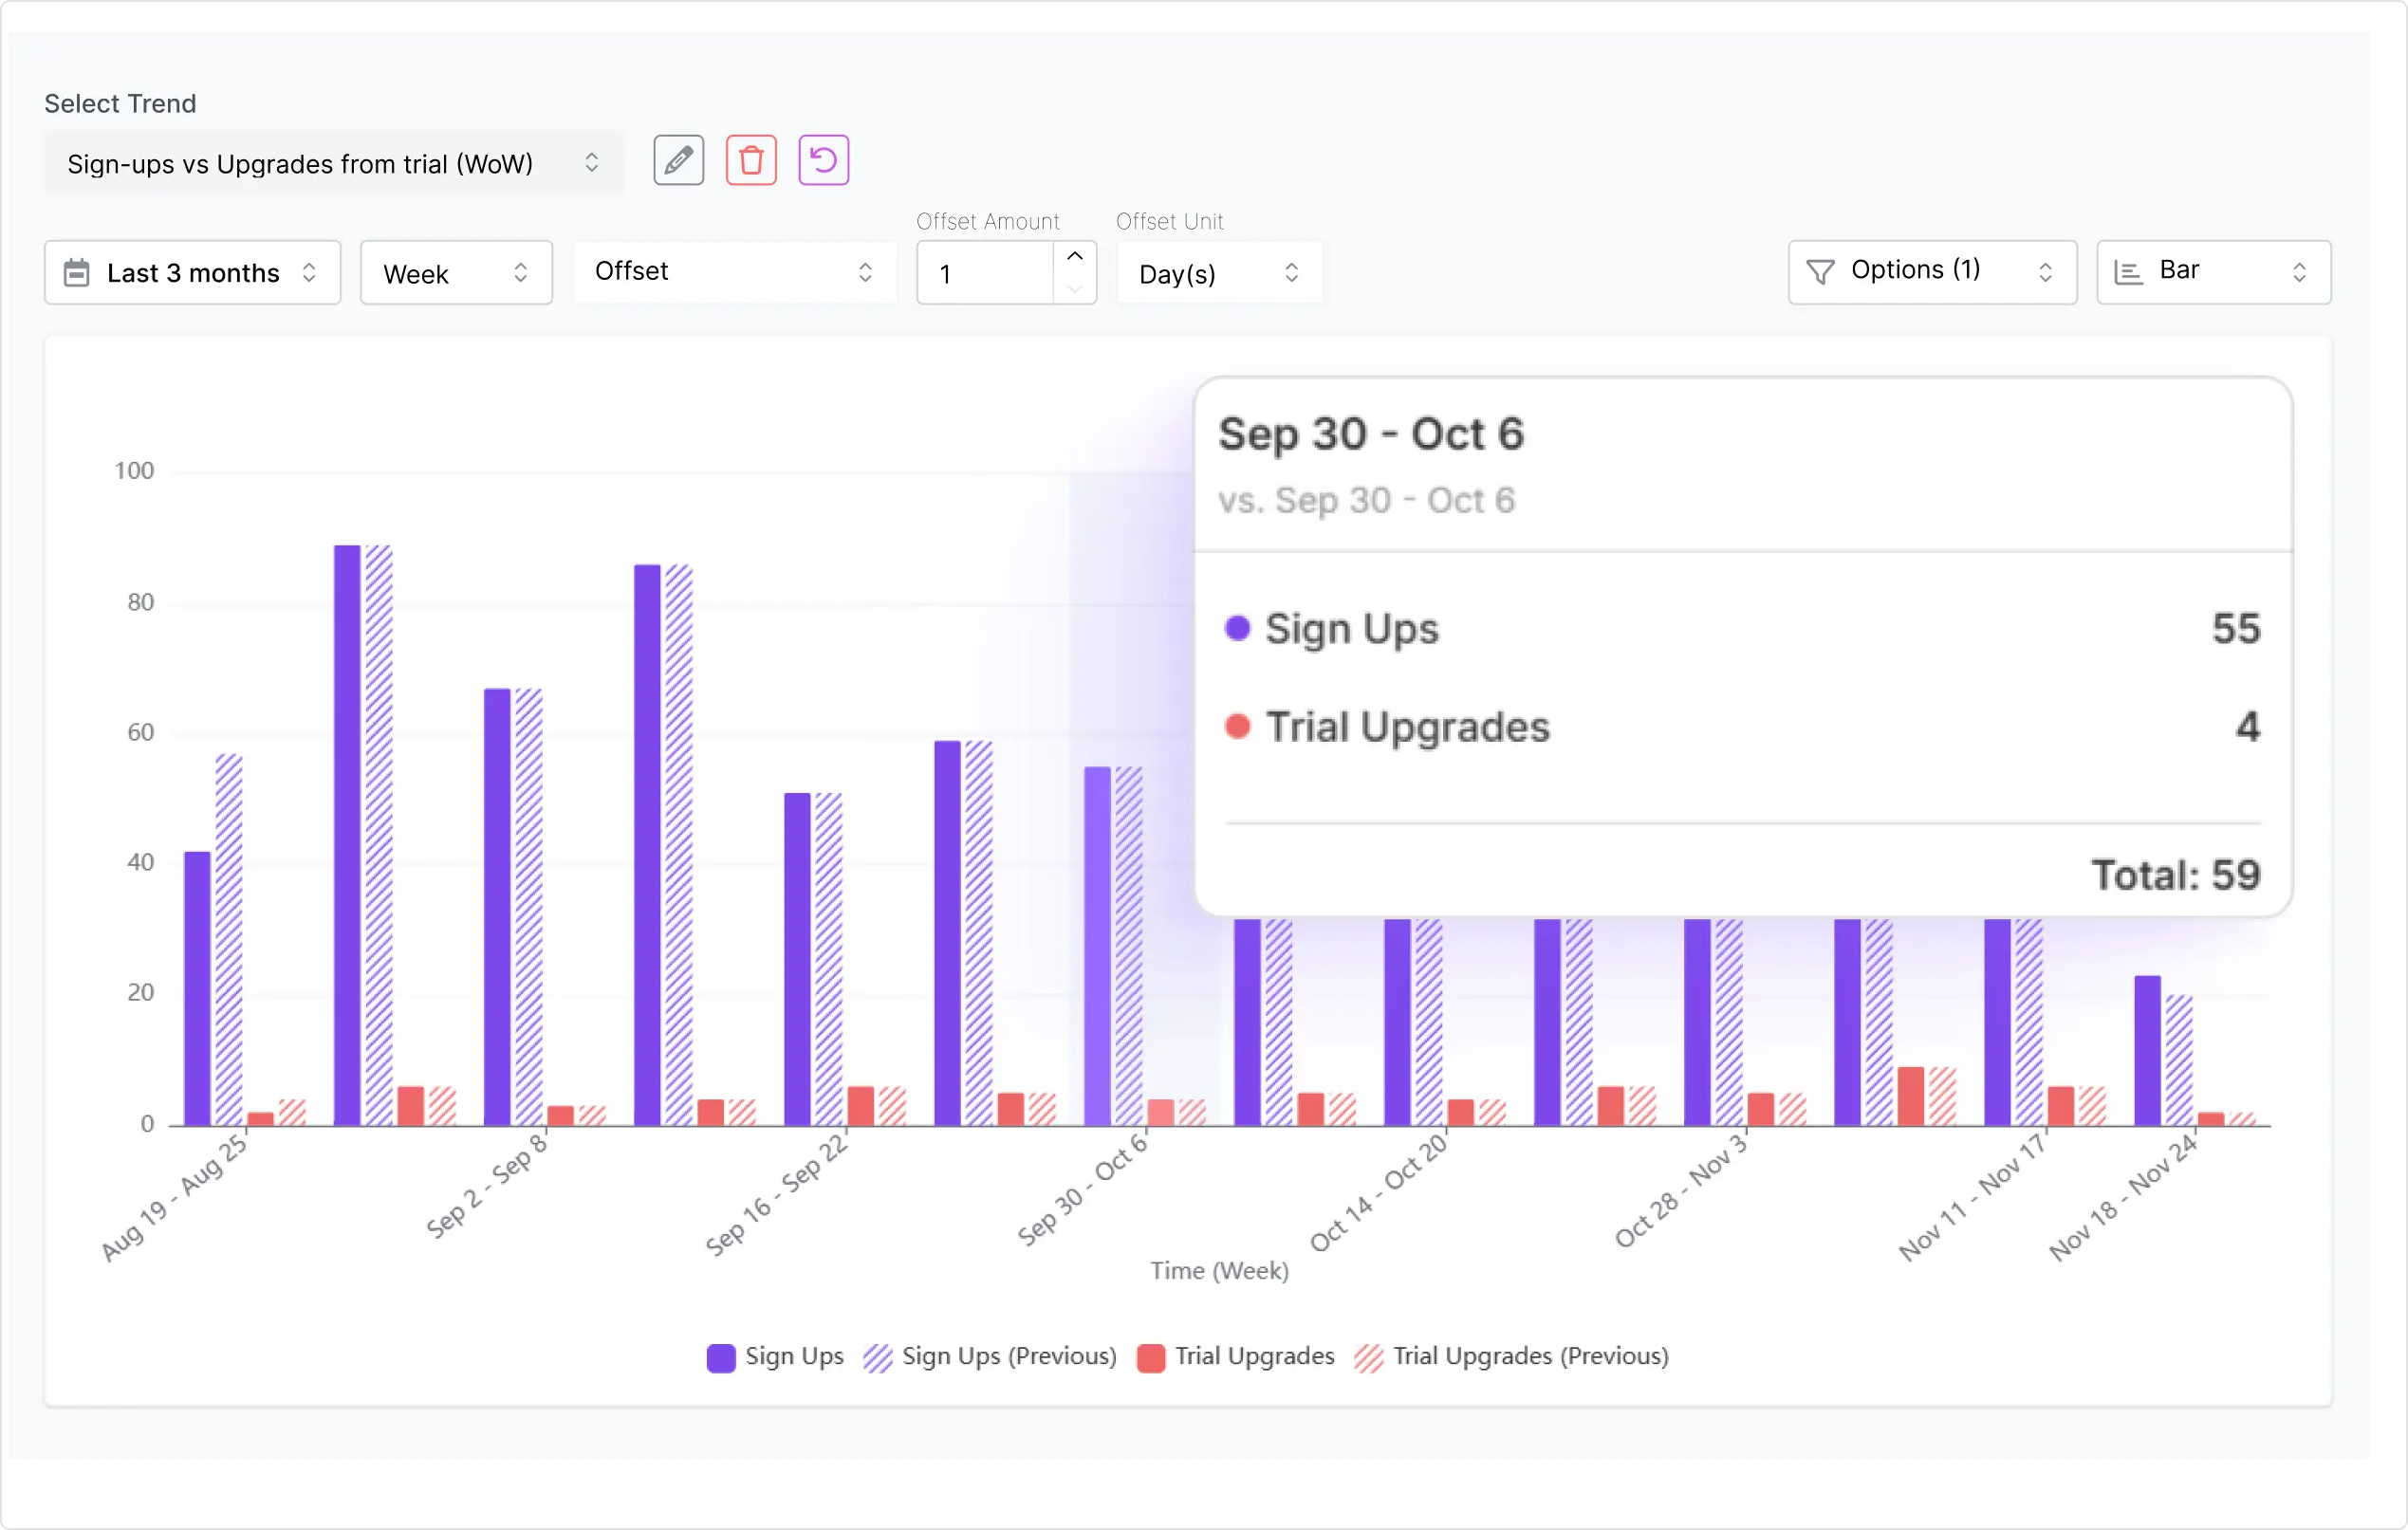
Turn insights into meaningful outcomes with:
- Automated monitoring and alerts: Stay updated on key trends.
- Customizable dashboards: Tailor dashboards to your priorities.
- Collaboration tools: Share insights across teams.
- Integration capabilities: Connect with marketing and CRM tools.
Practical applications of Usermaven trends
Usermaven trends offer valuable insights into user engagement and system performance, helping you make data-driven decisions. These trends enable a better understanding of feature adoption, user behavior, and product performance.
1. Feature engagement analysis
Understand how users interact with specific features:
- Monitor usage patterns over time.
- Compare feature adoption across segments.
- Identify popular feature combinations.
- Assess the impact of feature updates.
2. User behavior analysis
Gain a deeper understanding of user behavior:
- Map user journeys through your product.
- Identify conversion paths and drop-off points.
- Analyze session duration and frequency of engagement.
3. Performance monitoring
Keep track of critical performance metrics:
- Monitor page load times and system performance.
- Track error rates and API response times.
Maximizing the value of Usermaven trends
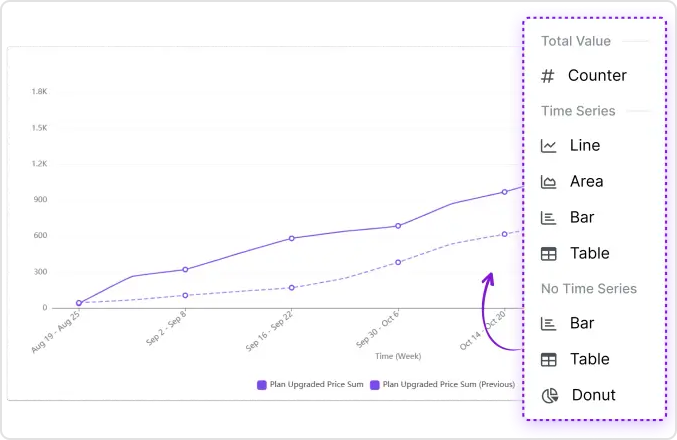
To maximize the value of Usermaven trends, it’s crucial to set clear objectives, use effective visualizations, and follow a regular review cycle. These practices ensure you can draw meaningful insights that support informed decision-making and growth.
Start with clear objectives
Define the purpose of your analysis:
- Identify key metrics to track.
- Determine patterns to uncover.
- Set goals for decision-making and success measurement.
Use the right visualizations
Choose effective ways to represent your data:
- Line charts: For time-based trends.
- Bar charts: For comparing metrics.
- Pie charts: For proportional analysis.
- Tables: For detailed data reviews.
Establish regular review cycles
Stay consistent in analyzing trends:
- Daily: Monitor critical metrics.
- Weekly: Review emerging trends.
- Monthly: Dive deeper into patterns.
- Quarterly: Use insights for strategic planning.
Why Usermaven trends matter for your business?
Many analytics tools struggle to provide actionable insights. Usermaven trends bridges this gap by offering:
- Comprehensive data collection: Covers all user touchpoints.
- Flexible visualization options: Makes patterns easy to identify.
- Granular filtering capabilities: Enables precise analysis.
- Real-time monitoring: Keeps your data up-to-date.
- Custom event tracking: Tailors insights to your business needs.
Setting up trend analysis in Usermaven
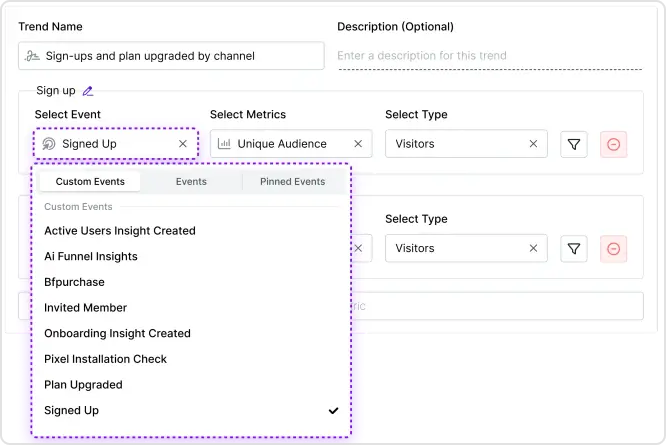
Getting started
- Navigate to the “Trends” section in your dashboard.
- Click “Create trend” to begin.
- Name your analysis (e.g., “Feature adoption Q4”).
- Select your initial metric and apply the necessary filters.
Configuring metrics and events
Usermaven supports a variety of event types for in-depth analysis:
- Custom events: Monitor unique user actions with custom tracking.
- Standard events: Automatically track built-in events like page views.
- Pinned events: Highlight key auto-captured metrics.
Tracking event properties
Usermaven enables detailed event analysis with properties such as:
- Page properties: Base URL, full URL, path, title, and domain.
- Geographic data: Insights by city, country, and region.
- User identification: Track unique IDs, advertising IDs, and session sources.
- Session properties: Analyze session duration, page views, and technology details.
The power of Usermaven trends
Usermaven trends is more than a visualization tool – it’s a complete analytics platform that combines data, insights, and action. Its flexibility and depth make it an essential tool for driving growth and uncovering opportunities in complex data.
Best practices for effective product trend analysis
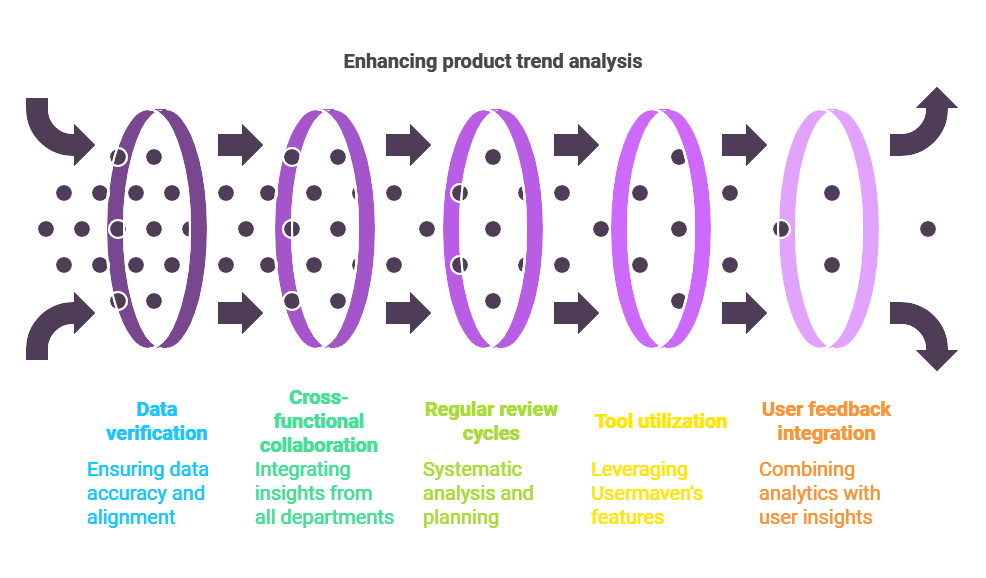
- Check your data frequently
Aim to confirm that your tracking tags and event definitions continue to align with your current goals. It can be easy to lose track when new features launch or product strategies shift. Usermaven’s real-time dashboards help you spot any mismatch early.
- Collaborate cross-functionally
Involving multiple departments leads to richer insights. Marketers bring information about user acquisition and brand perception. Developers know how the product is built and can respond fast if a backend issue affects user behavior. Product managers see where features fit into the overall plan. By sharing data in Usermaven, each group stays connected. For secure remote collaboration across teams, some rely on a Linux VPN download.
- Set regular review cycles
A monthly or quarterly review often works well, depending on your release schedule and the complexity of your product. Create a pattern: gather data, discuss the meaning, plan changes, and then review again after a set period. Once teams establish regular review and follow-up processes, Business process automation tools can help standardize recurring tasks, approvals, and cross-departmental handoffs, making it easier to turn product insights into consistent action.
- Use the Usermaven toolset fully
Automatic tracking, AI-driven suggestions, and customer journey analytics are all built-in. Narrow your analysis by segmenting users based on acquisition channel, user role, or even geography. This can turn broad data into focused insights.
- Balance numbers with direct user input
You can measure how often a feature is used, but you also need to know why users behave that way. Combining product analytics tools with surveys, interviews, or sentiment analysis can fill those gaps. With Usermaven, you can integrate feedback loops that offer context behind the statistics.
In summary,
Product trend analysis is an essential tool for modern SaaS companies, and platforms like Usermaven make it accessible and actionable. By understanding both the theoretical foundations and practical applications, you can leverage trend analysis to make better decisions and drive product success.
Remember that effective trend analysis is an iterative process. Start with the basics, gradually incorporate more advanced analyses, and always focus on turning insights into action. With Usermaven’s comprehensive toolset, you’re well-equipped to begin this journey and make data-driven decisions that impact your product’s success.
Power up your SaaS
with perfect product analytics
FAQs
How often should you conduct product trend analysis?
The frequency depends on factors like your product lifecycle and how fast your market moves. Some teams check real-time analytics daily for quick insights, while more in-depth reviews might happen monthly or quarterly to measure progress and set new objectives. Usermaven’s live dashboards allow you to do both.
What tools are needed for effective trend analysis?
Although spreadsheets and manual tracking may serve as an entry point, a dedicated analytics platform offers a smoother process and more precise data. Usermaven stands out by automatically capturing user events and providing AI-based recommendations that speed up the discovery of new trends.
How can Usermaven help with product trend analysis?
Usermaven is an all-in-one platform that collects data from your website and product, flags user behaviors, and recommends next steps. Automatic event tracking eliminates extra coding, while AI-driven analysis highlights emerging changes and potential areas of improvement.
What are the key metrics to track?
Specific metrics vary by business model, but many product-led growth teams follow acquisition rates, conversion rates, retention or churn, and feature adoption. Usermaven allows you to set and track custom metrics, ensuring they match the exact goals of your product.
Updated

Written by
Lauren Brooks
Lifecycle Marketing Strategist
Lauren Brooks is a lifecycle marketing strategist with 4+ years of experience helping SaaS businesses create meaningful customer experiences. She specializes in user engagement, retention, and conversion optimization, helping brands build stronger customer relationships beyond acquisition.
All articles by Lauren →