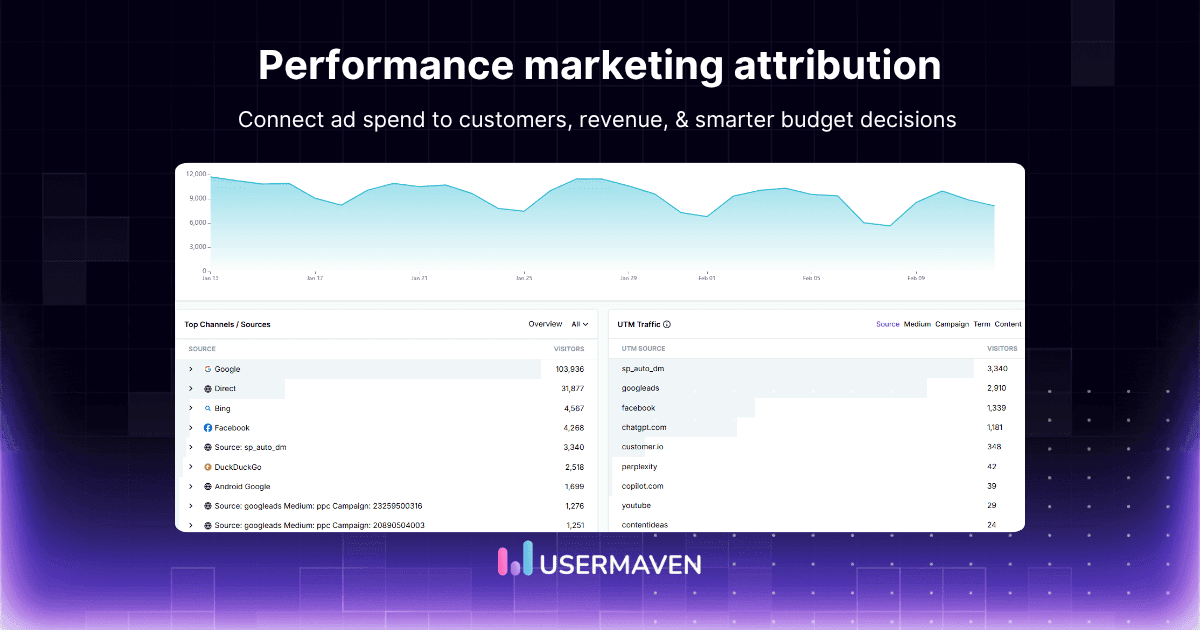
Multi-touch attribution helps marketers understand how several interactions contribute before a customer converts instead of giving all the credit to one click.
A strong marketing attribution software setup preserves those interactions long enough to evaluate how channels work together.
But the model is only as reliable as the journey underneath it. Missing touchpoints, broken identity resolution, the wrong attribution window, or a weak conversion goal can change the result before Linear, U-shaped, or Time-decay attribution is applied.
This guide explains how multi-touch attribution works, how models assign credit, why attribution windows and identity affect accuracy, where attribution stops short of causality, and how to build a system reliable enough to guide marketing decisions.
Multi-touch attribution at a glance
Multi-touch attribution is a marketing measurement method that distributes conversion or revenue credit across multiple eligible touchpoints in an observed customer journey according to a defined attribution model and attribution window.
The words eligible, observed, model, and window matter. MTA does not see every influence on a buyer. It allocates credit among the interactions the measurement system captured and allowed into the analysis.
Multi-touch attribution explained
| Question | Answer |
| What does MTA measure? | Contribution of multiple observed touchpoints to a chosen outcome |
| What can receive credit? | Eligible interactions inside the attribution window |
| What determines credit? | The attribution model or weighting rule |
| What outcome can be attributed? | Leads, conversions, pipeline, revenue, upgrades, or LTV |
| Does MTA prove causality? | No. It allocates credit across observed journeys. |
| Best use | Journey analysis, assist visibility, channel diagnostics, and tactical optimization |
Main risk: Treating incomplete or model-dependent credit as objective causal truth.
Key takeaways
- MTA shares credit: It prevents every conversion from being reduced to only the first or final interaction.
- The model is not the first decision: Tracking, identity, touchpoint eligibility, attribution window, and outcome definition come first.
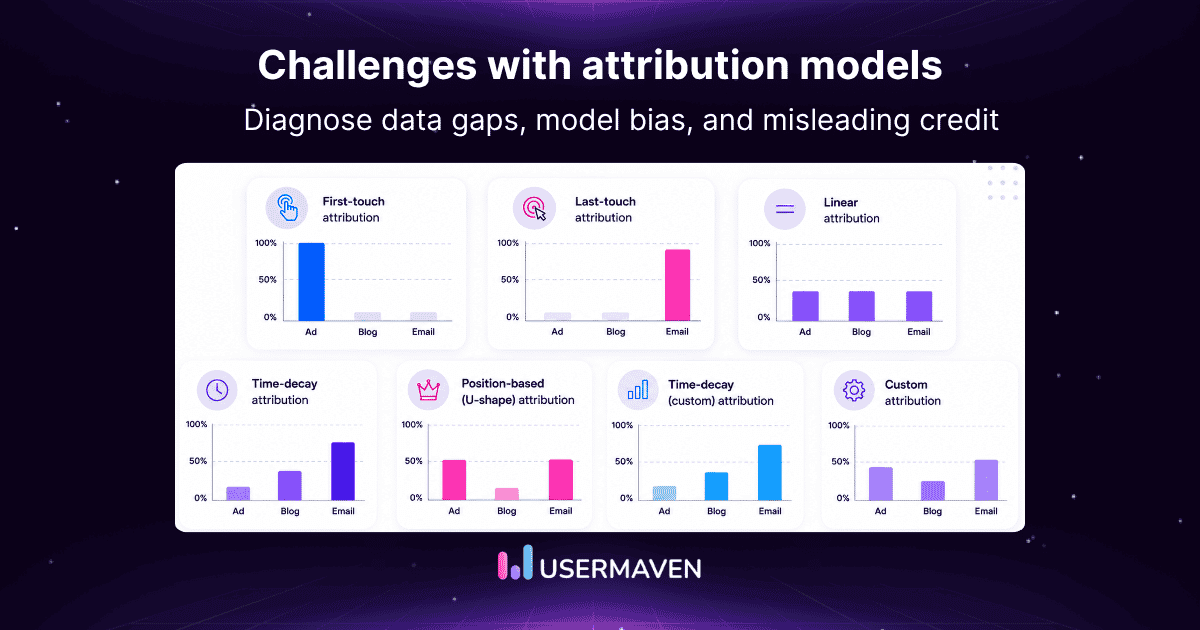
- Not every attribution model is multi-touch: First-touch and last-touch are useful single-touch baselines, while Linear, Time-decay, and U-shaped distribute credit across several interactions.
- Different models can produce different channel winners: Comparing models shows how sensitive a budget conclusion is to attribution assumptions.
- Attribution is not causality: MTA describes credit across observed journeys. Incrementality is better suited to asking whether marketing caused additional outcomes.
- B2B MTA needs account context: Several people can contribute to one opportunity, so contact-level paths often need to roll up to account and CRM outcomes.
- Revenue matters more than raw conversions: For SaaS and B2B, attribution may need to continue from signup into pipeline, revenue, retention, and LTV.
How multi-touch attribution works
A reliable MTA system is better understood as a sequence than as a model menu: capture the journey, connect identities, define what counts, choose the lookback window and business outcome, then allocate credit and validate the conclusion.

1. Capture marketing interactions
The first layer is observability. Common touchpoints include paid clicks, organic visits, content interactions, email, referrals, direct visits, campaign landing pages, signup events, product actions, and CRM interactions when those sources are integrated.
MTA can only distribute credit across interactions the system can observe. Reliable event tracking therefore matters before any attribution formula does.
2. Resolve identities
A customer may visit anonymously, return on another session, sign up later, and eventually appear in a CRM. Identity resolution determines whether those events remain separate fragments or become one journey.
For B2B, the challenge is larger because several contacts may belong to one company. Contacts Hub can connect anonymous and identified activity to user and company profiles, which gives attribution more context than session-level reporting alone.
3. Define eligible touchpoints
Multi-touch attribution does not have to mean that every interaction receives credit. Teams need explicit eligibility rules: whether pageviews count, whether repeated visits are separate touches, whether direct traffic is included, whether ad impressions are available, and which offline or sales interactions can be brought into the journey.
This is a governance choice as much as a technical one. If low-signal events are treated as equally meaningful touches, the model can dilute the interactions that actually represent intent.
4. Choose an attribution window
The attribution window defines how far back an interaction can remain eligible for credit. A touchpoint can exist in the raw history yet disappear from the attribution result simply because it falls outside the selected lookback period.
5. Choose the business outcome
Attribution needs an outcome. That might be a signup, demo request, qualified lead, opportunity, Closed Won deal, purchase, upgrade, or customer value metric. The same marketing journey can look strong against signups and weak against revenue, so the conversion definition changes the business meaning of the report.
6. Apply an attribution model
Only after the journey and eligibility rules are stable should the credit rule be applied. Linear, U-shaped, Time-decay, W-shaped, and algorithmic approaches answer different questions because they encode different assumptions about which stages matter most.
7. Validate the result
A useful attribution report should survive scrutiny. Compare the same outcome under more than one reasonable model, examine different time periods, and validate high-stakes budget decisions against other evidence such as CRM quality, incrementality tests, or marketing mix modeling when appropriate.
Unlock insights that drive growth
The basic multi-touch attribution formula
At the simplest level, MTA converts a model-assigned share into attributed business value.
| Attributed value for a touchpoint = Conversion value x Model-assigned credit share Total credit across all eligible touchpoints = 100% |
Linear attribution formula
Linear attribution gives the same credit to every eligible interaction:
| Credit per eligible touchpoint = 100% / Number of eligible touchpoints |
If a $10,000 conversion has five eligible touchpoints, each receives 20% of the credit, or $2,000 of attributed value. A linear attribution model makes every eligible interaction equally important by construction, which is easy to audit but can flatten meaningful stage differences.
Multi-touch attribution example
Consider one B2B journey that eventually produces $10,000 in Closed Won revenue:
| LinkedIn ad -> Organic article -> Email -> Google Ads -> Direct visit -> Demo -> $10,000 Closed Won |
Assume the five marketing interactions before the demo are eligible for attribution. The underlying journey is identical in every row below. Only the credit rule changes.
Same journey, different attribution models
| Model | Organic | Google Ads | Direct | ||
| Linear | 20% | 20% | 20% | 20% | 20% |
| U-shaped | 40% | 6.67% | 6.67% | 6.66% | 40% |
| Illustrative Time-decay | 5% | 10% | 15% | 25% | 45% |
| Last-touch baseline | 0% | 0% | 0% | 0% | 100% |
The Time-decay row is illustrative because implementations can use different decay logic. The lesson is more important than the exact percentages: the same observed journey and the same $10,000 outcome can produce very different channel stories under different attribution assumptions
Multi-touch attribution models compared
There is no universally best model. The right model depends on the business question, sales cycle, and the assumptions a team is willing to make about early, middle, and late-stage interactions. Nielsen separates rules-based single-touch, rules-based multi-touch, and algorithmic attribution, which helps distinguish simple baselines from models that distribute credit across several interactions.
Important distinction: first-touch and last-touch are attribution models, but they are single-touch models. They are useful comparison baselines, not types of multi-touch attribution.
Linear attribution
Linear attribution assigns equal credit to every eligible touch. It is easy to explain and useful as a neutral starting point when there is no defensible reason to privilege one stage, but equal credit can flatten meaningful differences between discovery, nurture, and closing interactions.
Time-decay attribution
A time-decay attribution model gives progressively more credit to interactions closer to conversion. It can fit journeys where later-stage intent matters more, but it can systematically understate early demand creation when the sales cycle is long.
U-shaped attribution
U-shaped, or position-based, attribution typically gives 40% of credit to the first eligible interaction and 40% to the final eligible interaction, with the remaining 20% shared across the middle. It emphasizes both discovery and conversion while still recognizing assists.
The U-shaped attribution model is useful when the opener and closer are strategically important, but the 40/20/40 weighting remains an assumption rather than a discovered causal truth.
W-shaped attribution
W-shaped attribution is often used in B2B to emphasize three milestones such as first touch, lead creation, and opportunity creation. Exact implementations vary, so teams should document the milestones and weights rather than assuming every vendor uses the same formula.
Custom weighted attribution
Custom models let a business assign weights around its own funnel logic. That can improve relevance, but it also creates a risk: a custom model can encode internal beliefs and then appear to validate them. The weighting logic should therefore be documented and compared against simpler baselines.
Algorithmic and data-driven attribution
Algorithmic approaches use observed data and statistical or machine-learning methods instead of only fixed weights. They can detect patterns that rule-based models miss, but complexity does not make the output automatically causal or unbiased.
Data-driven attribution uses observed conversion patterns to assign credit rather than relying only on fixed rules, but the underlying data quality and model transparency still determine how much confidence the output deserves.
Single-touch vs multi-touch attribution
Single-touch models answer a narrower question by assigning 100% of credit to one interaction. Multi-touch models widen the lens and acknowledge that several interactions can participate in the same conversion journey.
Single-touch vs multi-touch attribution
| Factor | Single-touch | Multi-touch |
| Credit | One interaction receives 100% | Several eligible interactions share credit |
| Complexity | Lower | Higher |
| Journey visibility | Limited to the chosen edge of the journey | Broader path and assist visibility |
| Data requirement | Lower | Higher identity and tracking requirements |
| Best use | Simple acquisition or closing-channel reporting | Longer, multi-step customer journeys |
| Main weakness | Ignores assists and middle interactions | Depends heavily on model assumptions and data quality |
Use first-touch attribution when the question is which source started the measurable journey, and last-click attribution when the question is which source was closest to conversion. Use MTA when the interactions between those endpoints matter to the decision.
Attribution windows can change the answer before the model does
An attribution model can only allocate credit to interactions that remain eligible inside the attribution window.
Suppose a LinkedIn interaction happened 120 days before a Closed Won conversion. Whether LinkedIn receives any credit may be determined before Linear or U-shaped attribution is even applied.
Lookback-window example
| Lookback window | Is the 120-day LinkedIn touch eligible? |
| 30 days | No |
| 90 days | No |
| 180 days | Yes |
| 365 days | Yes |
Changing the window from 90 to 180 days can therefore change attributed channel contribution even when the attribution model never changes. This is why teams with long sales cycles should review days-to-convert and buying-cycle length before accepting a default window.
The seven layers of reliable multi-touch attribution
A sophisticated model cannot rescue a broken measurement foundation. A useful way to audit MTA is to work through seven reliability layers in order.

Multi-touch attribution reliability stack
| Layer | Question to answer |
| 1. Coverage | Are the important interactions actually captured? |
| 2. Identity | Can interactions be connected to the same person or account? |
| 3. Eligibility | Which interactions are allowed to receive credit? |
| 4. Window | How far back can an interaction remain eligible? |
| 5. Outcome | Are you attributing leads, pipeline, revenue, or LTV? |
| 6. Model | How should eligible touchpoints share credit? |
| 7. Validation | Does the conclusion survive another model or measurement method? |
This stack changes the usual order of attribution discussions. Model selection is layer six, not layer one. If coverage, identity, or outcome definition is weak, debating a more sophisticated weighting rule will not fix the underlying measurement error.
Why multi-touch attribution becomes inaccurate
MTA usually becomes unreliable because the observed journey is incomplete, identities are disconnected, or the analysis rules do not match the real buying process. The problems below are more consequential than small differences between model formulas.

Missing touchpoints
Offline events, private communities, word of mouth, review sites, dark social, ad blockers, browser restrictions, consent choices, and walled-garden data can all remove interactions from the observable path. Adobe’s explanation of multi-touch attribution limitations notes that offline and external influences can remain outside the observable journey, which is why MTA should not be the only source of marketing evidence.
Broken identity resolution
If an anonymous visitor returns on another device, signs up later, or uses a different identifier, the journey can fragment. The model may then treat one buyer as several unrelated people, which changes both the path and the credit allocation.
Wrong touchpoint eligibility
If every low-signal interaction is allowed into the model, credit can become diluted. If too many interactions are excluded, the path becomes artificially simple. Eligibility rules should be documented and applied consistently.
Short attribution windows
A short window can erase the channels that create demand early in a long journey. This is especially risky in B2B, enterprise, and high-consideration purchases where discovery may happen months before the commercial event.
Wrong conversion outcome
Optimizing attribution around free signups can lead to a different budget than optimizing around paid upgrades or Closed Won revenue. The outcome should reflect the decision being made, not simply the easiest event to track.
CRM gaps
For revenue attribution, a clean marketing path is not enough. If deal stages, opportunity associations, amounts, or Closed Won events are missing or delayed, the attribution system cannot reliably connect marketing with the commercial record.
Model overconfidence
A precise number such as 27.4% attributed revenue can look more certain than it is. The model may be applying exact arithmetic to incomplete data and subjective assumptions. Precision in the output is not the same thing as certainty in the conclusion.
Multi-touch attribution is not causal attribution
Multi-touch attribution assigns credit. It does not by itself prove incremental causal impact.
If an MTA report says LinkedIn received 30% of attributed revenue, that does not mean removing LinkedIn would reduce revenue by exactly 30%. The number describes how observed credit was allocated under the selected rules.
This distinction matters most when the decision is large and irreversible, such as cutting a channel, changing annual budget allocation, or evaluating brand investment.
Attribution vs causality
| Question | Best measurement approach |
| Which observed touchpoints receive credit across customer journeys? | Multi-touch attribution |
| Would the outcome have changed without the campaign? | Incrementality testing / experiments |
| How does aggregate channel investment relate to business outcomes over time? | Marketing mix modeling |
Nielsen makes a similar distinction between fractional attribution and incrementality: fractional credit can guide granular optimization, while incrementality is better suited to the question of whether advertising created additional lift.
Multi-touch attribution vs marketing mix modeling
MTA and MMM are complementary measurement systems, not interchangeable versions of the same report. MTA is journey-level and interaction-oriented. MMM works with aggregated spend and outcomes over time and can incorporate broader channel and external effects.
MTA vs MMM
| Factor | Multi-touch attribution | Marketing mix modeling |
| Unit of analysis | Observed user or account journeys | Aggregated channel and business data |
| Granularity | Touchpoint, campaign, source, path | Channel and investment level |
| Typical use | Tactical journey and campaign optimization | Strategic budget allocation and channel mix |
| Identity dependence | Higher | Lower |
| Offline/external factors | Harder to capture | Can be incorporated statistically |
| Speed | Often near real time or frequent | Usually periodic |
The choice between multi-touch attribution vs marketing mix modeling depends on the question being asked. Mature teams often use MTA for tactical path analysis and MMM for broader allocation rather than forcing one system to answer every measurement problem.
Drive business growth
with AI-powered analytics
Multi-touch attribution for B2B marketing
B2B attribution adds an identity problem that many consumer examples skip: several people can influence one opportunity. The measurement chain often needs to move beyond one browser or one contact.
| Interaction -> person -> account -> CRM opportunity -> pipeline -> revenue |
Multiple people can influence one opportunity
A marketer may engage with content, a finance stakeholder may visit pricing, and a technical evaluator may attend a webinar. If these journeys remain isolated, contact-level attribution can miss the combined account story.

Long sales cycles increase measurement pressure
B2B journeys can stretch across months, which makes attribution windows, anonymous-to-known identity, and source preservation more consequential. Early discovery channels are particularly easy to lose under short lookback periods or last-touch reporting.
CRM data completes the journey
B2B marketing attribution becomes much more useful when web and campaign activity can be connected to account-level identity, opportunity stages, pipeline, and Closed Won revenue across a buying committee.
Contact-level and account-level attribution are different
Contact-level attribution explains one person’s measurable path. Account-level attribution combines the activity of several people around one company or opportunity. Both views are useful, but they answer different questions and should not be collapsed into one number without a clear account-matching rule.
Which outcome should multi-touch attribution measure?
The conversion event determines what the attribution report optimizes. A model that is useful for lead generation may be misleading for revenue or customer quality.
Lead attribution
Lead attribution connects marketing interactions with form fills, signups, or qualified leads. It is useful for acquisition reporting but can overvalue channels that produce volume without producing customers.
Pipeline attribution
Pipeline attribution moves the outcome deeper into the commercial process. For B2B, this is often more useful than raw lead attribution because it distinguishes activity from opportunities that sales considers economically meaningful.

Revenue attribution
Revenue attribution attaches marketing credit to purchases or Closed Won value, moving the measurement target from conversion volume to actual commercial outcomes.
LTV attribution
For subscription businesses, the final question may be customer quality rather than first purchase. Two channels can generate the same number of customers but very different retention, expansion, and lifetime value. A consistent approach to calculating SaaS LTV helps connect acquisition credit with downstream customer value instead of treating a cheap conversion as automatically valuable.
Multi-touch attribution for SaaS and product-led growth
For SaaS and PLG, the customer journey continues after signup. Marketing attribution becomes more useful when it can be connected with product behavior and lifecycle outcomes.
| Source -> Signup -> Activation -> Feature adoption -> Upgrade -> Retention -> Expansion |
A campaign that drives many trials but weak activation can look excellent in acquisition-only reporting. Connecting attribution with product analytics reveals whether acquired users actually adopt the product, while customer journey analytics preserves the path across acquisition and post-signup behavior. Funnel analysis can then show where those users progress or drop off after acquisition.
This is especially important for hybrid SaaS models where marketing, product usage, and sales-assisted revenue all contribute to the customer outcome.
How to build a multi-touch attribution system
The implementation sequence should start with the decision you need to make, not with a favorite model. Twilio frames multi-touch attribution implementation around data collection, unification, and visualization; the workflow below adds the eligibility, outcome, and validation steps needed to make the result decision-ready.
Step 1. Define the business outcome
Choose the event that represents success: signup, demo, opportunity, revenue, or another meaningful milestone. If the outcome is wrong, the attribution model will optimize the wrong behavior very efficiently.

Step 2. Audit tracking coverage
Inventory the channels and interactions that matter. Confirm UTMs, referral logic, ad integrations, website events, forms, product events, and CRM events before comparing channel performance.
Step 3. Resolve identities
Define how anonymous sessions become known users and, for B2B, how contacts map to companies or opportunities. Test whether a returning user remains connected across the journey.
Step 4. Define eligible interactions
Write down what can receive attribution credit. Decide how direct traffic, repeat visits, impressions, email interactions, internal pages, and sales touches are handled.
Step 5. Choose the attribution window
Use the observed sales cycle and days-to-convert distribution rather than a convenient default. Long-cycle acquisition sources need enough lookback history to remain visible.
Step 6. Connect CRM and revenue data
For B2B or revenue use cases, ensure opportunities, stage changes, and values can be matched to the marketing identity. This is where attribution stops being a traffic report and becomes commercial measurement.
Step 7. Start with an interpretable model
A simple Linear or position-based model can be easier to audit than a complex black box. The first objective is not sophistication. It is understanding how the system changes credit and whether the result is plausible.
Step 8. Compare multiple models
Run the same outcome under several reasonable models. Large swings reveal that the conclusion depends on attribution assumptions and should not be treated as a stable channel truth.
Step 9. Validate against business outcomes
Check whether high-attribution channels also produce better pipeline, revenue, retention, or customer quality. Where possible, compare major allocation decisions with experiments or other causal evidence.
Step 10. Revisit the rules as the journey changes
Attribution is not a one-time configuration. New channels, longer buying cycles, product changes, CRM processes, and tracking restrictions can all make an old eligibility or window rule obsolete.
Model comparison is sensitivity analysis
Instead of asking which attribution model is objectively correct, ask whether the marketing decision changes when reasonable attribution assumptions change. That turns model comparison into sensitivity analysis.
Illustrative model-sensitivity example
| Channel | Last-touch | Linear | U-shaped | Time-decay | Interpretation |
| Google Ads | 50% | 35% | 30% | 42% | Strong across models; relatively robust |
| 5% | 25% | 35% | 10% | Highly model-sensitive | |
| 25% | 20% | 15% | 30% | Often stronger late in the journey | |
| Organic | 20% | 20% | 20% | 18% | Stable supporting contribution |
These percentages are illustrative, not customer data. The key lesson is that model disagreement is information. If a budget recommendation disappears when the model changes, the recommendation is assumption-sensitive and deserves more validation.
Multi-touch attribution metrics that matter
MTA is most useful when the metrics reflect the business decision rather than only reporting more attribution percentages. Useful measures include:
- Attributed conversions: The number of conversions receiving credit under the selected model.
- Attributed pipeline: Opportunity or pipeline value connected to marketing touchpoints.
- Attributed revenue: Revenue allocated to channels, campaigns, or content under the chosen model.
- Assisted conversions: Conversions where a channel participated without receiving the final touch.

- Conversion paths: Recurring sequences of channels or touchpoints before conversion.
- Time to conversion: How long it takes customers to convert from an earlier eligible interaction.
- Cost per attributed opportunity: Spend relative to pipeline-generating outcomes rather than only leads.
- Attributed ROAS: Revenue attributed to paid activity relative to spend.
- LTV by acquisition path: Customer value after acquisition, useful for SaaS and recurring-revenue businesses.
When multi-touch attribution is useful
MTA is strongest when the customer journey includes several measurable interactions and the business needs tactical visibility into how channels work together.
- Journeys span several digital channels or sessions.
- Anonymous and known activity can be connected with reasonable confidence.
- Multiple channels assist conversions even when they do not close them.
- Teams need campaign, source, content, or path-level optimization.
- Marketing data can be connected to downstream outcomes such as pipeline or revenue.
- The business can explain and document its attribution rules.
When multi-touch attribution is not enough
MTA should not be stretched beyond the questions its data can answer. It becomes insufficient when the unobserved part of the customer journey is too large or when the decision requires causal proof.
- Offline influence dominates the buying decision.
- Cross-device or cross-domain identity is too fragmented.
- Most important touchpoints occur inside platforms that do not expose usable path data.
- The central question is incremental lift rather than observed journey credit.
- The business needs aggregate budget planning across major online and offline channels.
- Conversion volume is too low for stable model comparison.
Google’s work on privacy-preserving multi-touch attribution shows why modern measurement increasingly has to work with aggregated or privacy-preserving signals rather than assuming unlimited cross-site identity.
How to choose a multi-touch attribution tool
Choosing software is ultimately a decision about measurement architecture. Look beyond the number of dashboards and assess whether the platform can support the journey and business outcome you actually need.
- Identity resolution: Can anonymous, known, and account activity be connected?
- Attribution windows: Can the lookback period match the real buying cycle?
- Model flexibility: Can teams compare single-touch and multi-touch views without rebuilding reports?
- CRM and revenue connection: Can conversions be tied to opportunities, revenue, or other commercial records?
- B2B account support: Can several contacts be understood around one company or opportunity?
- Product and lifecycle context: Can acquisition be connected to activation, retention, and LTV when needed?
- AI transparency: Can users inspect the data and rules behind AI-generated insights?
- Implementation effort: How much engineering, warehouse work, or manual maintenance is required?
Multi-touch attribution tools should be compared by operating model, identity requirements, attribution windows, and the business records they can connect back to marketing.
Popular multi-touch attribution tools
The best platform depends on whether the measurement center is SaaS behavior, B2B revenue, blended measurement, or ecommerce. These five tools represent different operating models rather than five versions of the same dashboard.
Usermaven
Usermaven combines multi-touch attribution with website and product analytics, customer journeys, CRM revenue, retention, and AI-assisted analysis. It is particularly relevant for SaaS and B2B teams that want attribution and behavioral context in the same analytics environment.
Dreamdata
Dreamdata is built around account-centric B2B attribution and revenue measurement. It fits teams where buying committees, CRM pipeline, account journeys, and activation are central to the measurement architecture.
HockeyStack
HockeyStack combines multi-touch attribution with broader GTM and revenue intelligence. It is geared toward B2B teams that want buyer journeys, pipeline analysis, and model comparison inside a wider revenue workflow.
Rockerbox
Rockerbox combines journey-level attribution with broader measurement approaches such as marketing mix modeling and incrementality. It fits teams that want MTA to sit alongside other methods instead of carrying the entire measurement burden alone.
Triple Whale
Triple Whale is oriented toward ecommerce attribution and revenue measurement. It connects marketing touchpoints with orders and revenue, making it more relevant when paid media and the ecommerce purchase journey are the center of analysis.
How Usermaven handles multi-touch attribution
Usermaven operationalizes multi-touch measurement inside one analytics environment. Its multi-touch attribution software combines channel and content attribution, conversion paths, revenue context, flexible models, long lookback windows, and behavioral analytics alongside website analytics.
Compare channel and source attribution
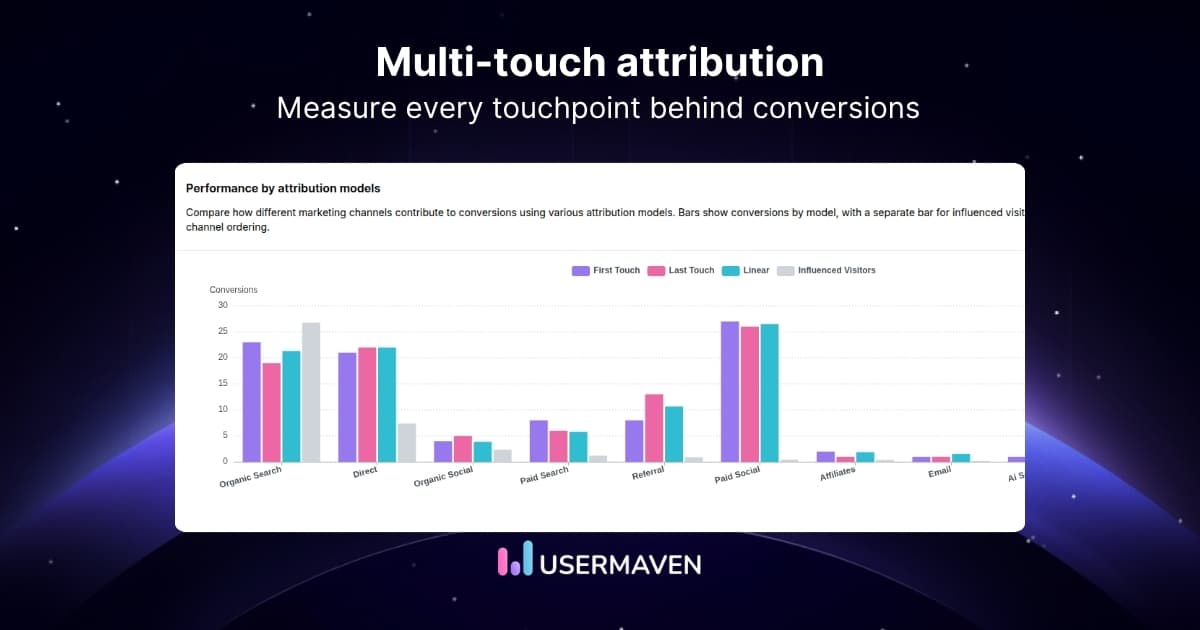
The channel and source view compares model-assigned conversions with influenced conversions across paid, organic, referral, email, AI, and other sources. A marketing attribution dashboard makes those differences easier to monitor without reducing performance to the final click.

Measure content attribution across models
The Content Attribution view compares individual pages across multiple attribution models, showing how a page can start, assist, or close a conversion journey. This makes content attribution more useful than judging articles only by traffic or the last page viewed before conversion.

Analyze conversion paths and touchpoint positions
Conversion Paths separates early, middle, and late touchpoints so teams can see where channels repeatedly appear before a selected goal. This exposes recurring channel combinations and assists that a single-touch report would hide.

See how long customers take to convert
Days to Convert shows how long customers take to reach the selected conversion goal. That distribution helps teams decide whether a short default window is enough or whether longer lookback periods are needed to preserve early demand-creation touches.

Compare influenced and model-assigned conversions
The attribution table separates influenced conversions from the credit assigned under the active model. This helps identify channels that participate in many journeys even when their model-assigned share is smaller.

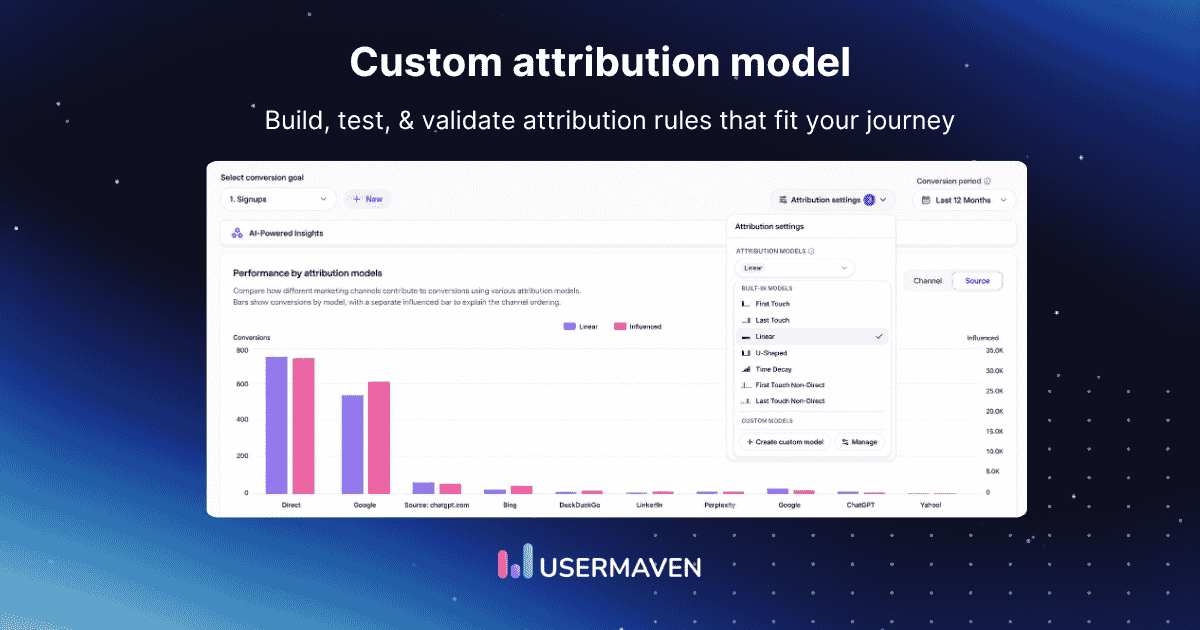
Usermaven currently supports seven attribution models overall: First Touch, Last Touch, First Touch Non-Direct, Last Touch Non-Direct, Linear, U-shaped, and Time-decay. That set includes both single-touch and multi-touch approaches, so teams can compare assumptions instead of treating every model as MTA.
Connect attribution to revenue
The attribution workflow connects campaigns and channels with conversion value, pipeline, and revenue so upper-funnel and assisting channels can be evaluated against commercial outcomes rather than only sessions or leads.
Combine attribution with behavioral analytics
Because attribution sits alongside funnels, product analytics, contact profiles, journeys, retention, and other behavioral views, teams can investigate what happened after acquisition instead of treating the conversion as the end of the story. These views can also be combined inside analytics dashboards for recurring reporting.
Investigate results with Maven AI
Maven AI can surface attribution patterns such as high-performing channels, underperforming campaigns, assisting touchpoints, and delayed-conversion behavior. AI can accelerate investigation, but it cannot reconstruct missing touchpoints with certainty.
Query attribution through MCP
Usermaven MCP can expose authorized marketing attribution, revenue, CAC, LTV, funnels, journeys, retention, reports, and other analytics to compatible external AI clients. With write permissions enabled, supported analytics objects can be created or updated only when the user requests and approves the action.
Real-world multi-touch attribution: ContentStudio
ContentStudio is a strong example because the attribution problem was not theoretical. The team ran paid campaigns across Google and Meta, tested LinkedIn and X, and could see platform clicks and reported conversions, but could not reliably connect those signals to paying customers.
ContentStudio’s case study documents a journey where a user could click a Google ad, return through organic search, and convert after a Meta retargeting ad while only one source, or none, received meaningful credit before multi-touch attribution was implemented.
What changed
ContentStudio connected campaign data with signups, plan upgrades, demo bookings, revenue, and days-to-convert. That let the team evaluate paid channels against actual plan-upgrade revenue, identify delayed conversions, and shift spend toward campaigns with confirmed commercial performance.
The practical value was budget confidence. Campaigns that looked weak in the first week sometimes converted 7 to 14 days later, so the team avoided cutting spend before the full conversion window had elapsed.
ContentStudio attribution evidence
| Outcome | Result | Why it matters |
| ROAS | +30% | Budget moved toward campaigns confirmed to generate paying users |
| Signups | +128% | Acquisition converted at greater scale |
| Plan upgrades | +92% | Downstream customer value improved |
| Demo bookings | +242% | Funnel changes captured more high-intent demand |
| Traffic | +329% | Acquisition scaled while attribution stayed connected to outcomes |
The evidence does not prove that MTA alone caused every improvement. It shows the more defensible business use of attribution: connect spend to actual customer outcomes, preserve enough conversion history, and use the result to change budget allocation.
B2B example: Hyperengage
Hyperengage had a different version of the same problem. Its customer journeys were long and multi-touch, involving content, organic search, podcasts, LinkedIn, email, and partnerships. Platform dashboards and last-click reporting fragmented the picture.
Hyperengage’s case study records attributed channel coverage expanding from 4 to 6 and organic search emerging as a genuine first-touch source where the previous view showed none. The team also saw how often prospects returned through different channels before converting.
The important outcome was not a prettier attribution chart. Hyperengage changed how it judged content, SEO, paid campaigns, and partner activity, and became more willing to pull back from sources that produced traffic without enough qualified conversion contribution.
Multi-touch attribution checklist
Before trusting an MTA report, verify both the measurement foundation and the way the result is being interpreted.
- Track the important channels: Confirm that paid, organic, referral, email, content, and other meaningful touchpoints are captured. Missing channels create a journey that looks cleaner than the one customers actually experienced.
- Resolve anonymous and known users: Test whether anonymous visits connect to later identified activity where appropriate. Fragmented identity can make one customer appear as several unrelated journeys.
- Map B2B contacts to accounts: When several people influence one opportunity, contacts should roll up to the correct company or CRM record. Otherwise the account journey remains incomplete.
- Define touchpoint eligibility: Document which interactions are allowed to receive attribution credit. This prevents weak events from diluting meaningful engagement or hidden rules from changing reports unexpectedly.
- Match the attribution window to the buying cycle: Use days-to-convert and sales-cycle data instead of accepting a convenient default. A short window can remove the channels that created demand early.
- Choose a commercially meaningful outcome: Decide whether the report should optimize signups, pipeline, revenue, upgrades, or LTV. The easiest conversion to track is not always the outcome the business should fund.
- Connect CRM and revenue data: When budget decisions depend on pipeline or Closed Won value, make sure the commercial record is connected to the marketing journey. Traffic-level attribution is not enough for a revenue decision.
- Compare more than one model: Run the same outcome under at least two reasonable attribution models. Large swings reveal that the conclusion is sensitive to weighting assumptions.
- Acknowledge dark and offline influence: Document meaningful interactions the system cannot observe, including word of mouth, private communities, events, and offline sales activity. MTA should not imply that invisible influence did not exist.
- Validate major budget changes: Use CRM quality, experiments, incrementality, MMM, or other evidence when the decision is large. Attribution should inform the decision, not become the only proof behind it.
- Treat attribution as credit allocation: A precise percentage describes the model’s allocation of observed credit. It should not be interpreted as an equally precise estimate of causal lift.
Final verdict
Multi-touch attribution is valuable because real customer journeys rarely consist of one meaningful interaction. By sharing credit across several observed touchpoints, MTA makes assists, paths, and channel collaboration visible in a way first-touch or last-click reporting cannot.
But model selection is not the foundation. Reliable MTA depends on the sequence: tracking -> identity -> eligibility -> window -> outcome -> model -> validation. If the earlier layers are weak, a more sophisticated model only produces a more sophisticated version of the same data problem.
Use MTA to diagnose journeys, assists, and tactical channel contribution. Compare models before reallocating budget, connect attribution to revenue or customer value where possible, and complement MTA with incrementality, MMM, CRM evidence, or other methods when the decision requires stronger causal confidence.
Ready to see Usermaven in action? Explore the platform or book a demo for a closer look.
FAQs
1. What is multi-touch attribution?
Multi-touch attribution is a marketing measurement method that distributes conversion or revenue credit across multiple eligible touchpoints in an observed customer journey. The selected attribution model determines how that credit is shared, while the attribution window determines which earlier interactions remain eligible.
2. How does multi-touch attribution work?
MTA captures marketing interactions, connects them to the same user or account, defines which touchpoints are eligible, applies a lookback window and conversion outcome, then uses an attribution model to divide credit among the eligible interactions. Reliable systems also compare the output with other models or business evidence.
3. What are the main multi-touch attribution models?
Common multi-touch models include Linear, Time-decay, U-shaped or position-based, W-shaped, custom weighted, and algorithmic approaches. First-touch and last-touch are useful attribution models too, but they are single-touch models because one interaction receives all the credit.
4. What is the difference between single-touch and multi-touch attribution?
Single-touch attribution assigns 100% of conversion credit to one interaction, usually the first or last touch. Multi-touch attribution distributes credit across several eligible interactions, giving marketers a broader view of assists and the path to conversion.
5. Which multi-touch attribution model is best?
There is no universally best model. The right choice depends on the business question, buying cycle, touchpoint coverage, and outcome being measured. A better practice is to compare multiple reasonable models and see whether the marketing conclusion remains stable.
6. Is multi-touch attribution accurate?
Updated

Written by
Ryan Mitchell
Marketing Analytics Strategist
Ryan Mitchell is a marketing analytics strategist specializing in campaign measurement, customer journeys, and marketing performance. He writes about analytics, reporting, and data-driven marketing strategies, helping SaaS and B2B teams measure what matters across every stage of the customer journey.
All articles by Ryan →