Table of contents
The customer acquisition metrics you must track to optimize growth
May 9, 2025
8 mins read
Written by Mahnoor Shahid

Let’s talk about getting new customers. It’s the lifeblood of any business, right? But figuring out if you’re doing it well can be tricky. That’s where customer acquisition metrics come in handy. In this guide, we will break down these important numbers so you can see what’s working and what’s not when it comes to bringing in new business.
Think of these metrics as your business GPS – they help you know if you’re heading in the right direction or if you need to take a different route. The good news? You don’t need to be a math whiz to understand them. Let’s dive in and make sense of the numbers that really matter for growing your customer base.
The foundation of customer acquisition success
Customer acquisition is more than just gaining new users – it’s about understanding the journey, costs, and long-term value of each customer. Before diving into specific metrics, it’s important to set up a good tracking system that captures accurate data.
Many businesses struggle with scattered analytics tools that don’t give the full picture of the customer journey. Having a unified approach to tracking customer acquisition metrics across different touchpoints gives you a complete view of your acquisition process.
Why traditional analytics falls short
Most traditional analytics platforms only focus on website traffic or app downloads without connecting these actions to actual customer conversion and retention. This disconnected approach makes it hard to understand which acquisition channels truly drive business value.
When you can’t see the whole picture, you end up making decisions based on incomplete information. It’s like trying to bake a cake with only half the recipe – the results probably won’t be what you hoped for. Proper customer acquisition metrics help fill in these gaps.
Essential customer acquisition metrics to track
Let’s explore the key metrics that will help you improve your customer acquisition strategy and get the most from your spending.
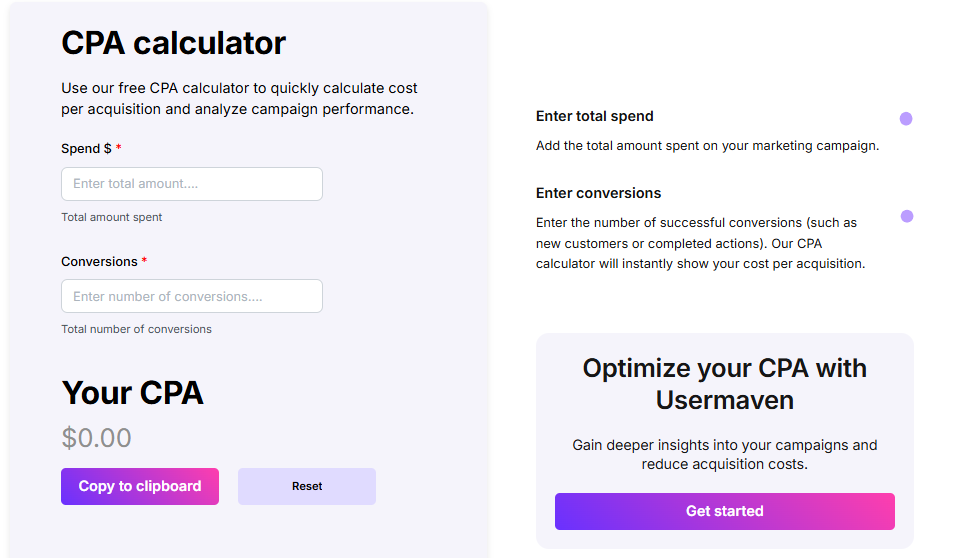
Customer acquisition cost (CAC)
Perhaps the most fundamental customer acquisition metric, CAC measures how much it costs to get a single new customer. This includes all marketing and sales expenses divided by the number of new customers gained in a specific period.
How to calculate CAC:
CAC = Total Acquisition Costs / Number of New Customers
For example, if you spent $10,000 on marketing and sales in a month and acquired 100 new customers, your CAC would be $100 per customer.
High CAC isn’t necessarily bad if those customers deliver significant lifetime value. However, tracking CAC by channel helps identify which acquisition sources provide the best return on investment.
For example, you might find that customers from organic search cost $50 to acquire, while those from paid social media cost $200. This doesn’t automatically mean you should ditch social media – it depends on what those customers are worth over time. Customer acquisition metrics give you this clarity.
Customer lifetime value (CLV)
Customer lifetime value represents the total revenue you can expect from a customer throughout their relationship with your business. CLV is essential for putting your acquisition costs in context.
How to calculate CLV:
CLV = Average Purchase Value × Average Purchase Frequency × Average Customer Lifespan
Let’s say your average customer spends $100 per purchase, buys from you 3 times per year, and remains a customer for 2 years. Their CLV would be $100 × 3 × 2 = $600.
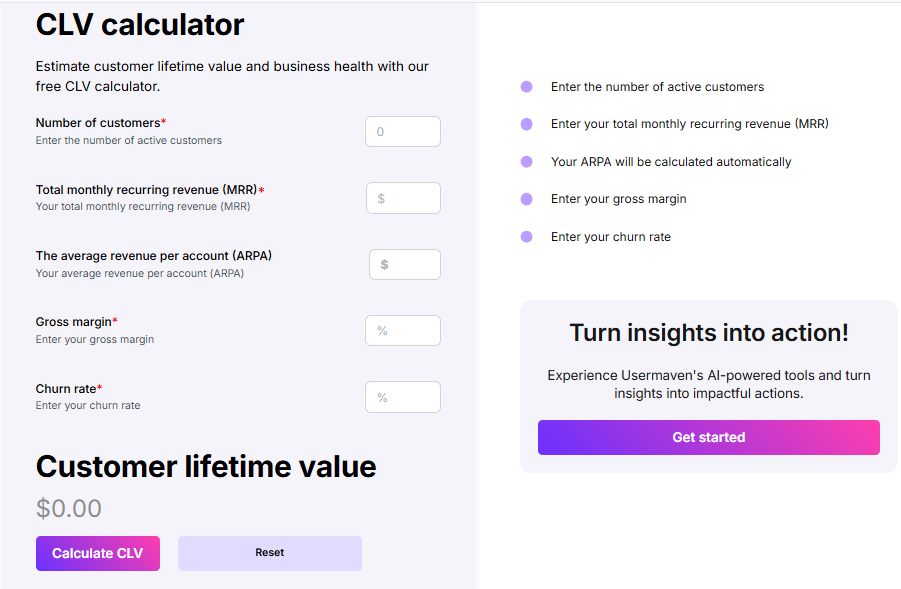
The CLV ratio tells you if your customer acquisition spending makes sense. Ideally, your CLV should be at least 3 times your CAC for a healthy business model. This is one of the most important customer acquisition metrics to keep an eye on for sustainable growth.
Conversion rate
Your conversion rate shows the percentage of visitors who take the desired action, whether that’s making a purchase, signing up for a newsletter, or creating an account.
How to calculate conversion rate:
Conversion Rate = (Number of Conversions / Total Visitors) × 100
If 5,000 people visit your website and 150 become customers, your conversion rate is (150 ÷ 5,000) × 100 = 3%.
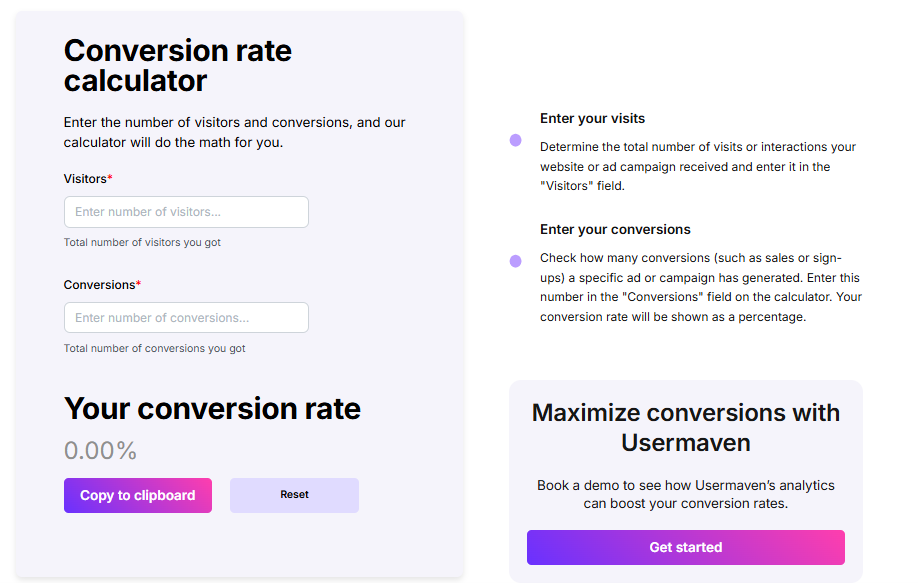
Low conversion rates might signal problems with your website, offer, or messaging. Breaking down conversion rates by traffic source, device type, and customer segment helps pinpoint exactly where improvements can make the biggest impact on your customer acquisition metrics.
Time to conversion
This customer acquisition metric tracks how long it takes from first contact to customer conversion. Shorter conversion times usually mean a smoother, more efficient acquisition process.
Many businesses overlook this metric, but it can reveal hidden friction points in your sales funnel. If people are taking weeks to convert when your competitors close the deal in days, something’s likely off in your process.
For example, if your data shows that customers typically visit your site 5 times over 12 days before purchasing, but after a website update, this extends to 8 visits over 20 days, you know something in your new design might be creating friction in the customer acquisition process.
Advanced customer acquisition metrics
Once you’ve mastered the basics, these advanced metrics will help you fine-tune your acquisition strategy.
Customer acquisition efficiency
This metric combines several factors to measure how efficiently you’re acquiring customers relative to your growth rate.
How to calculate customer acquisition efficiency:
Acquisition Efficiency = (New Annual Recurring Revenue / Sales & Marketing Expenses) × 100
An efficiency above 100% means you’re spending less on acquisition than the annual recurring revenue you’re generating – a good sign for sustainable growth. For example, if you generate $150,000 in new annual recurring revenue while spending $100,000 on sales and marketing, your acquisition efficiency is 150%.
Viral coefficient
The viral coefficient measures how many new users each existing user brings to your product through word-of-mouth or referrals. This is a particularly valuable customer acquisition metric for products with social sharing features.
How to calculate viral coefficient:
Viral Coefficient = Number of New Referral Users / Number of Existing Users
If 1,000 current users refer 1,200 new users in a given period, your viral coefficient is 1.2.
A viral coefficient greater than 1 means you’re getting exponential growth through referrals, while anything less than 1 means you’ll need to rely more on paid acquisition channels to maintain growth.
Return on advertising spend (ROAS)
ROAS measures the revenue generated for every dollar spent on advertising, making it particularly useful for evaluating paid customer acquisition channels.
How to calculate ROAS:
ROAS = Revenue from Advertising / Cost of Advertising
If you spend $5,000 on a Google Ads campaign that generates $15,000 in revenue, your ROAS is 3:1 or 300%.
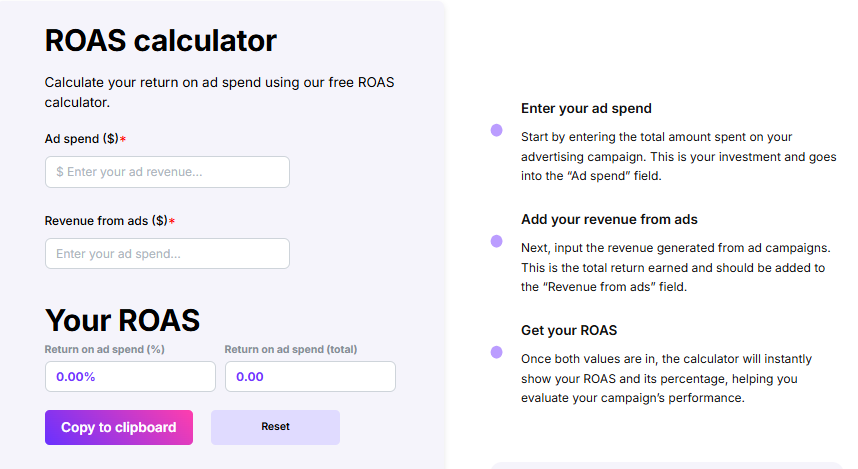
A ROAS of 2:1 means you’re getting $2 back for every $1 spent on ads. Different industries have different benchmarks for good ROAS, but generally, the higher the better. Tracking this customer acquisition metric helps optimize your advertising budget.
Segmenting customer acquisition metrics
Looking at acquisition metrics as one big number only tells part of the story. Breaking these metrics down by segment reveals insights that can drive smarter decisions.
For offline or hybrid campaigns, linking materials to digital touchpoints with the best QR code solution can help attribute specific segments to real-world interactions.
Channel-specific metrics
Different acquisition channels often perform dramatically differently. By tracking metrics like CAC, conversion rate, and CLV by channel, you can optimize your marketing mix for maximum efficiency.
You might discover that your email campaigns bring in customers with the highest lifetime value, while your Google Ads attract more customers but with lower average purchase values. These channel-specific customer acquisition metrics help you allocate resources where they’ll have the greatest impact.
For instance, if your data shows that customers acquired through content marketing have a CLV of $800 with a CAC of $200, while customers from paid ads have a CLV of $500 with a CAC of $300, you might want to invest more in your content strategy.
Cohort analysis
Cohort analysis groups customers by when they were acquired and tracks their behavior over time. This approach reveals whether your acquisition quality is improving or declining.
Key cohort metrics to track:
- Retention rates by acquisition cohort
- Revenue by cohort over time
- CAC payback period by cohort
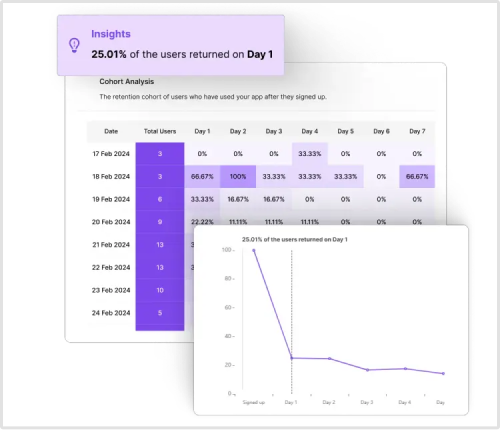
For example, you might notice that customers acquired during a big promotion tend to churn faster than those who came in through organic search. This insight could change how you plan future promotions and influence your overall customer acquisition metrics strategy.
Cohort analysis also helps you see if your customer acquisition efforts are improving over time. If customers acquired in recent months have higher retention rates than those acquired a year ago, your acquisition strategy is likely getting better.
How Usermaven enhances customer acquisition tracking
When it comes to tracking customer acquisition metrics effectively, Usermaven stands out as a comprehensive solution designed specifically for growth-focused businesses. Let’s explore how Usermaven can transform your approach to customer acquisition measurement.
Unified customer journey tracking
Usermaven connects the dots between different customer touchpoints, giving you a complete view of the customer journey from first click to purchase and beyond. Instead of jumping between different tools, you can see all your customer acquisition metrics in one intuitive dashboard.
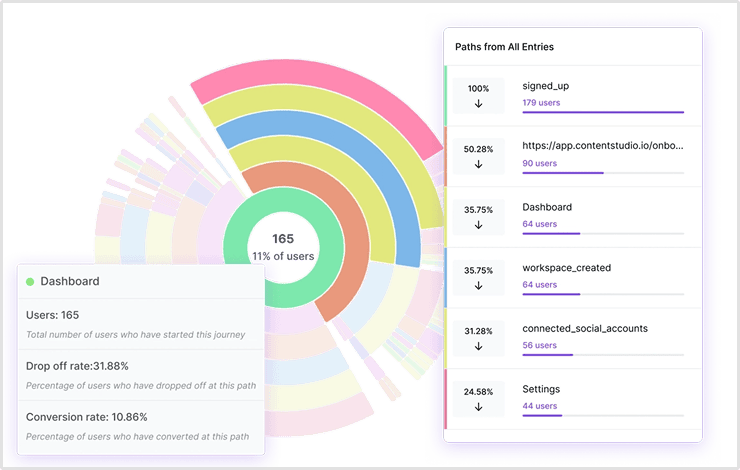
The platform captures every interaction a potential customer has with your business – from their first ad click or search query to their browsing behavior, email interactions, and purchase patterns. This unified approach eliminates data silos that plague many marketing teams.
Advanced multi-touch attribution
Understanding which channels truly drive conversions is critical for optimizing customer acquisition metrics. Usermaven goes beyond simple last-click attribution with sophisticated multi-touch attribution models that show how different marketing channels work together to convert customers.
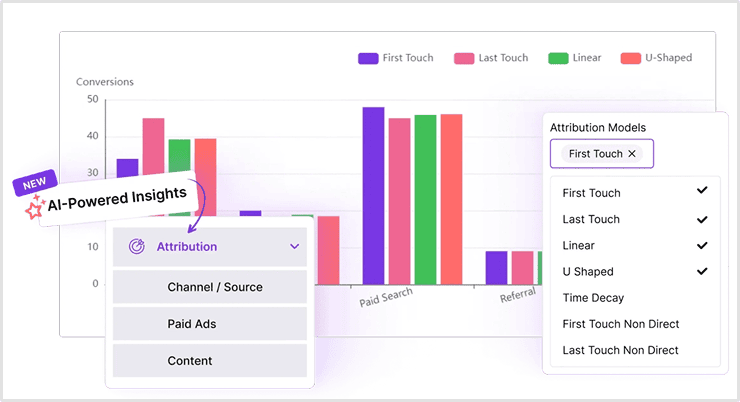
For example, you might discover that while your social media ads rarely lead directly to conversions, they’re often the first touchpoint for customers who eventually convert through organic search or email. Without this insight, you might incorrectly cut social media spending, damaging your acquisition funnel.
Real-time funnel visualization and analysis
See where potential customers drop off in your acquisition funnel with clear, real-time visualizations. Usermaven helps identify the weak points in your conversion process so you can fix them quickly and improve your customer acquisition metrics.
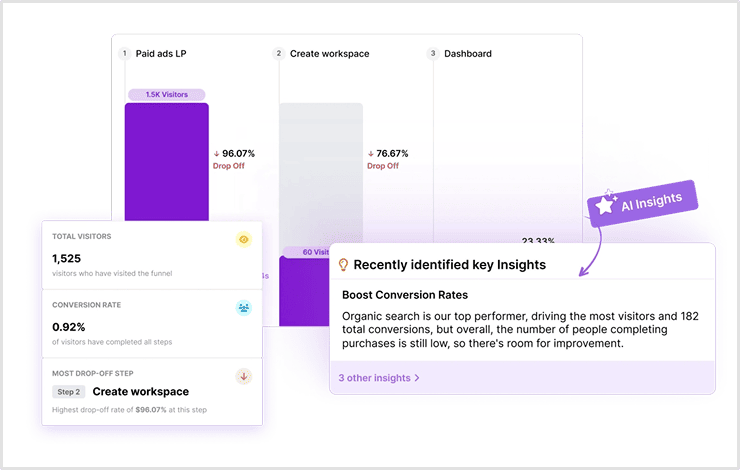
The platform allows you to create multiple funnel views for different user segments or acquisition channels, making it easy to compare performance and identify where specific improvements will have the greatest impact on your overall acquisition efficiency.
Seamless customer segmentation
Segment your customers based on acquisition source, behavior, and value to understand what works best for different types of customers. Usermaven makes this segmentation process intuitive and powerful, allowing you to drill down into your customer acquisition metrics with unprecedented detail.
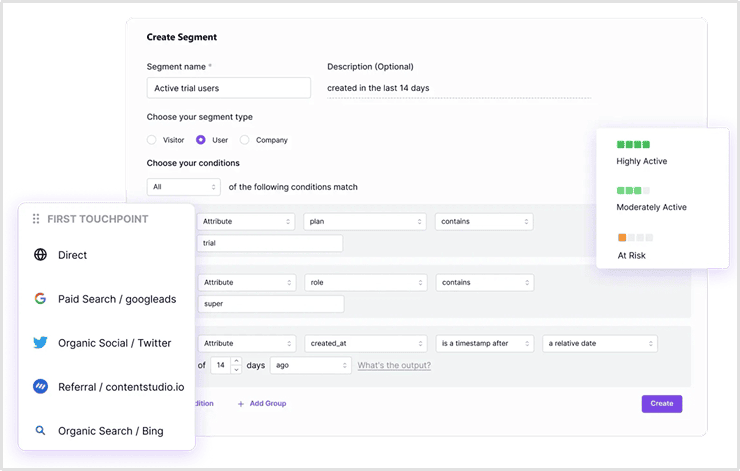
For instance, you can easily compare the behavior of customers acquired through different channels, with different campaign messages, or at different price points. These insights help you tailor your acquisition strategies to have the maximum impact on each customer segment.
Privacy-first data collection
As privacy regulations get stricter, having a tracking solution that respects user privacy is crucial for sustainable customer acquisition metric tracking. Usermaven provides accurate data without relying on soon-to-be-obsolete tracking methods like third-party cookies.
The platform uses a combination of server-side tracking, first-party cookies, and privacy-preserving identification methods to ensure your customer acquisition data remains accurate and complete even as the privacy landscape evolves. This future-proofs your analytics and gives you confidence in your metrics.
Common customer acquisition pitfalls
Even with good tracking in place, businesses often make these common mistakes when measuring customer acquisition performance.
Ignoring acquisition quality
Not all customers are created equal. Focusing only on reducing CAC without considering customer quality can lead to short-term gains but long-term revenue problems.
A customer who costs $50 to acquire but spends $1,000 over their lifetime is a much better investment than one who costs $20 to acquire but only spends $30 total. Your customer acquisition metrics should always consider quality alongside cost.
Overlooking attribution challenges
In today’s multi-touch customer journeys, attributing a conversion to a single channel oversimplifies reality. Without proper attribution modeling, you might put too much money into channels that seem effective but actually just catch people at the end of their decision process.
For example, your social media ads might influence someone who later searches for your brand name and converts through an organic search click. Without multi-touch attribution, organic search gets all the credit, and you might undervalue your social media campaigns in your customer acquisition metrics analysis.
Focusing on volume over efficiency
Many businesses become obsessed with acquiring more customers without paying enough attention to the efficiency of their acquisition process. This can lead to unsustainable growth and cash flow problems.
Your customer acquisition metrics should help you find the right balance between growth speed and efficiency. Sometimes, slowing down acquisition to improve unit economics can create a stronger foundation for future growth.
Neglecting retention in acquisition planning
Customer acquisition metrics should connect to retention metrics for a complete picture. Even the most efficient acquisition strategy will fail if customers churn quickly after converting.
When analyzing acquisition channels, always look at post-conversion metrics like activation rate, second purchase likelihood, and 90-day retention to ensure you’re acquiring customers who will stick around.
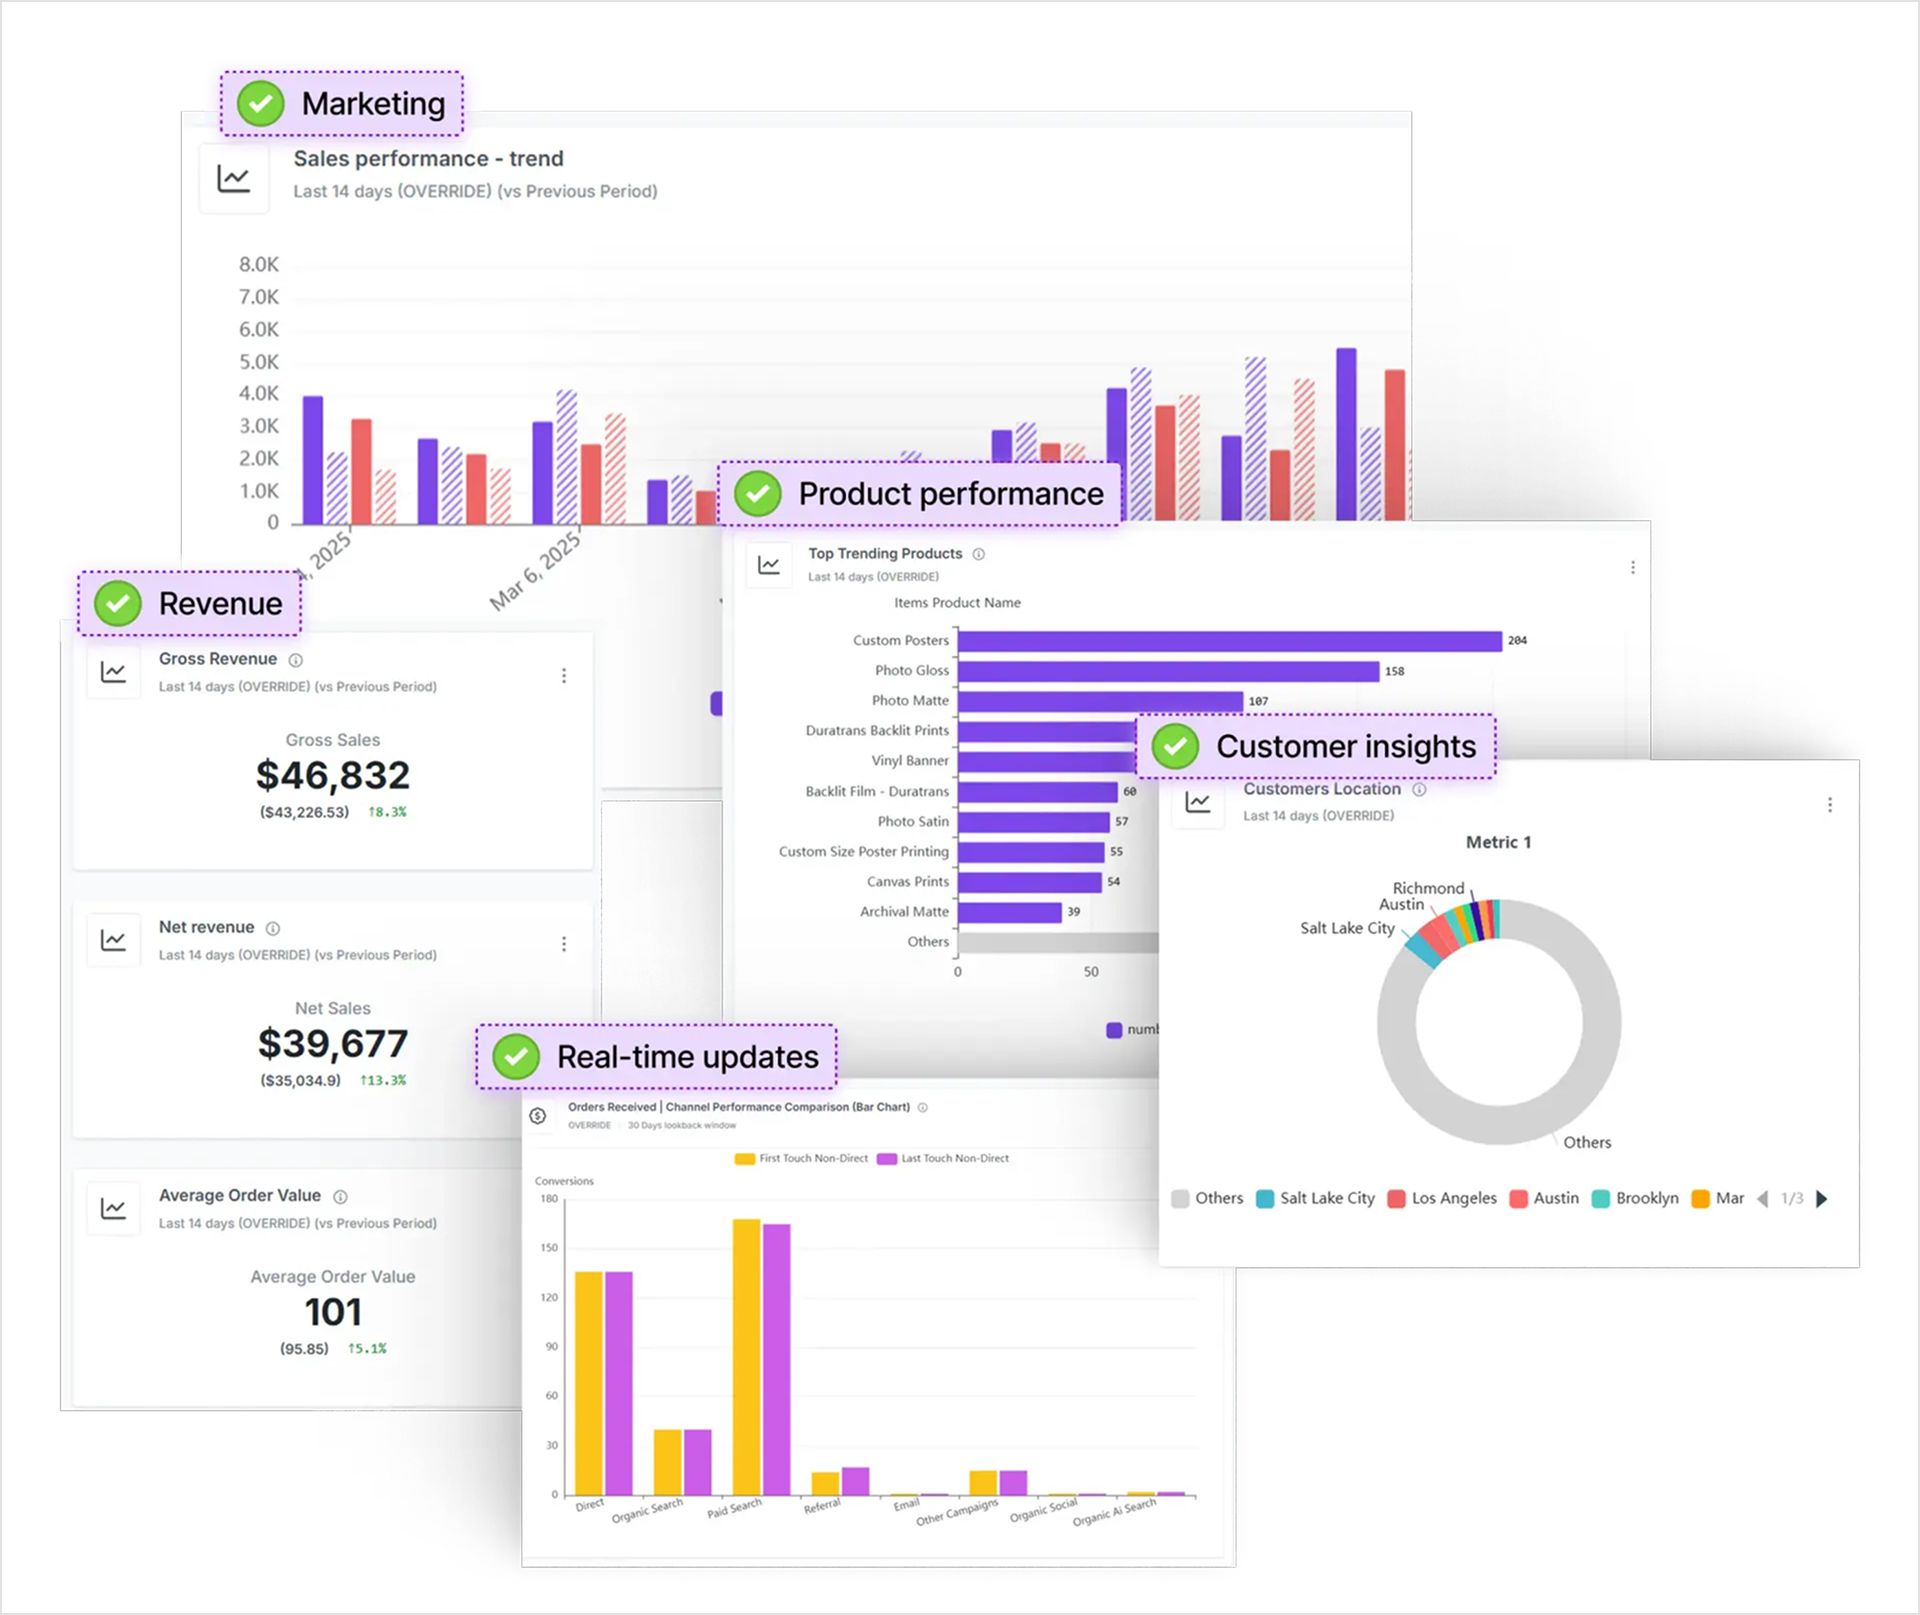
Building a customer acquisition metrics dashboard
Tracking these metrics is most effective when you can visualize them together. A well-designed dashboard brings your acquisition data to life, making it easier to spot trends and opportunities.
Essential dashboard elements
Your customer acquisition metrics dashboard should include:
- CAC by channel
- Conversion rates across the funnel
- CLV
ratio trends - Acquisition volume over time
- Payback period visualization
When all these metrics are visible at a glance, patterns emerge that might otherwise remain hidden. For instance, you might notice that while your overall CAC is increasing, one channel is bucking the trend and becoming more efficient.
Setting appropriate alerts
Not all metrics need daily monitoring. Set up alerts for significant changes in key customer acquisition metrics like:
- Sudden CAC increases
- Conversion rate drops
- Changes in channel effectiveness
With proper alerts, you’ll know immediately when your acquisition performance needs attention, without having to constantly check your dashboard.
Conclusion: From metrics to growth
Customer acquisition metrics are more than just numbers on a dashboard – they’re the compass that guides your growth strategy. By understanding and optimizing these key metrics, you can build a sustainable acquisition engine that fuels business growth.
Remember that acquisition is just the beginning of the customer journey. The most successful businesses connect acquisition metrics to activation, retention, and revenue metrics for a complete picture of customer lifecycle performance.
With tools like Usermaven and a solid understanding of customer acquisition metrics, you can turn acquisition data into actionable growth strategies that help your business thrive in an increasingly competitive marketplace. Start tracking, measuring, and optimizing today – your future customers are waiting, and your competitors are already doing it.
Target the right audience
with Usermaven Segments
*No credit card required
Frequently asked questions
1. What’s the difference between CAC and CPA?
While often used interchangeably, Customer Acquisition Cost (CAC) typically includes all marketing and sales expenses, while Cost Per Acquisition (CPA) usually refers specifically to the advertising cost to acquire a customer or lead. CAC gives a more comprehensive view of your customer acquisition metrics.
2. How often should I recalculate my customer acquisition metrics?
For most businesses, monthly calculations strike a good balance between timely insights and having enough data to identify true trends. However, businesses with high transaction volumes might benefit from weekly analysis, while those with longer sales cycles might opt for quarterly reviews.
3. Which customer acquisition metric is most important?
There’s no single “most important” metric – they work together to give you a complete picture. However, the CLV ratio is particularly valuable because it shows whether your acquisition efforts are economically sustainable in the long run.
4. How do I know if my CAC is too high?
Compare your CAC to industry benchmarks as a starting point, but the real answer depends on your business model and CLV. If your CLV ratio is below 3:1, your acquisition costs may be unsustainable unless you can increase customer value or retention.
5. Should I include customer success costs in CAC calculations?
Generally, no. CAC should focus on costs incurred before a customer converts. Customer success costs are better categorized as retention expenses. Keeping these separate helps maintain clear customer acquisition metrics that focus specifically on the acquisition process.
6. How can I lower my customer acquisition costs?
Focus on improving conversion rates, optimizing underperforming channels, increasing organic traffic, implementing referral programs, and retargeting website visitors. Each of these approaches can improve your customer acquisition metrics by either reducing costs or increasing conversion efficiency.
7. What’s a good conversion rate?
Conversion rates vary widely by industry, product type, and price point. Rather than aiming for a specific number, focus on continuous improvement of your own conversion rates. That said, the average website conversion rate is around 2-5%, with top performers reaching 10% or higher.
8. How does mobile affect customer acquisition metrics?
Mobile users often have different behavior patterns than desktop users, including shorter session times and different conversion paths. It’s important to segment your customer acquisition metrics by device type to develop appropriate strategies for each platform.
9. Can customer acquisition metrics predict future growth?
While not crystal balls, well-tracked acquisition metrics can help forecast growth by showing trends in acquisition efficiency, channel performance, and customer value. These insights allow for more accurate growth projections and better strategic planning.
10. How do I track offline customer acquisition metrics?
Use unique phone numbers, QR codes created with Replug’s QR code generator or The QR Code Generator (TQRCG), custom URLs, or promo codes for different offline channels. You can also implement post-purchase surveys asking how customers found you. Tools like Usermaven can help connect these offline touchpoints to your online customer acquisition metrics for a complete view.
Try for free
Grow your business faster with:
- AI-powered analytics & attribution
- No-code event tracking
- Privacy-friendly setup


